
Download
Latest Release| Version | Download |
|---|---|
| MotifScan 1.0.5 (2015-07-22) | MotifScan_1.0.5.tar.gz |
| MotifScan 1.0.4 (2015-04-20) | MotifScan_1.0.4.tar.gz |
| Group | Download |
|---|---|
| JASPARE CORE All | jaspar_2014_all_motif_list.txt |
| JASPARE CORE Vertebrata | jaspar_2014_vertebrates_motif_list.txt |
| JASPARE CORE Plantae | jaspar_2014_plants_motif_list.txt |
| JASPARE CORE Nematoda | jaspar_2014_nematodes_motif_list.txt |
| JASPARE CORE Insecta | jaspar_2014_insects_motif_list.txt |
| JASPARE CORE Fungi | jaspar_2014_fungi_motif_list.txt |
Get Started (Updated at 2015-08-24)
Obtain MotifScan
Download package from here.
Then extract the package and build from the source:
tar -zxvf MotifScan_*.*.*.tar.gz cd MotifScan_*.*.* sudo python setup install
Or use option --prefix to specify the installation position
python setup install --prefix=/home/jiawei
Under this circumstance, you should add your installation directory to PYTHONPATH and bash PATH:
export PYTHONPATH=/home/jiawei/lib/python2.7/dist-packges:$PYTHONPATH export PATH=/home/jiawei/bin:$PATH
Prepocess the Genome
Please process the genome sequence before your formally run the main MotifScan executable.
GenomeCompile -G hg19.fa [-o hg19_for_motifscan]
-G the genome sequence file in fasta/fa format. All chromosomes should be in one file.
A directory contaning compiled genome sequence and information would be generated by this command. It is required by main excutable.
Note: You only need run it once for each genome.
Motif Discovery
Search regions (-p), compiled motif PWM (-m) and genome (-g) are required for a common MotifScan task. And we recommend you to specify the gene annotation file (RefSeq) via option -t. With all these files prepared, use the following command to perform the program:
MotifScan –p Example/SL2548_Peaks.bed –m Example/human_motif_demo.txt -g hg19_for_motifscan
-p peak region file in bed-like format
-m motif information table
-g a pre-compiled genome directory generated by GenomeCompile
Compiled Motif PWM file (-m) should be organized as follows:
>MA0143.3
Sox2
max_score:9.572
score_cutoff:0.9799
0.513 0.997 0.001 0.997 0.997 0.546 0.001 0.001
0.201 0.001 0.997 0.001 0.001 0.001 0.001 0.001
0.284 0.001 0.001 0.001 0.001 0.001 0.997 0.997
0.001 0.001 0.001 0.001 0.001 0.452 0.001 0.001
Columns are seperated by tab.
MotifScan package has already contained the pre-compiled motif PWMs stemmed from JASPAR under the directory: motif
Compile Your Own Motif PWM
If you have some motifs (e.g. Example/motif_pwm_demo.txt) that have not be included in our pre-complied motif collection, you need to compile on your own by using the following command.
MotifCompile –M Example/motif_pwm_demo.txt –g hg19_for_motifscan
-M motif raw matrix file
-g a pre-compiled genome directory generated by GenomeCompile
Motif raw matrix file (Example/motif_pwm_demo.txt) should follow the format as below: motif id and motif name are followed by a positive weighted matrix, and columns are seperated by tabs.
>MA0599.1 KLF5
1429 0 0 3477 0 5051 0 0 0 3915
2023 11900 12008 9569 13611 0 13611 13611 13135 5595
7572 0 0 0 0 5182 0 0 0 0
2587 1711 1603 565 0 3378 0 0 476 4101
Five motif files representing different score cutoff are generated.
Manual (Updated at 2015-08-25)
MotifScan
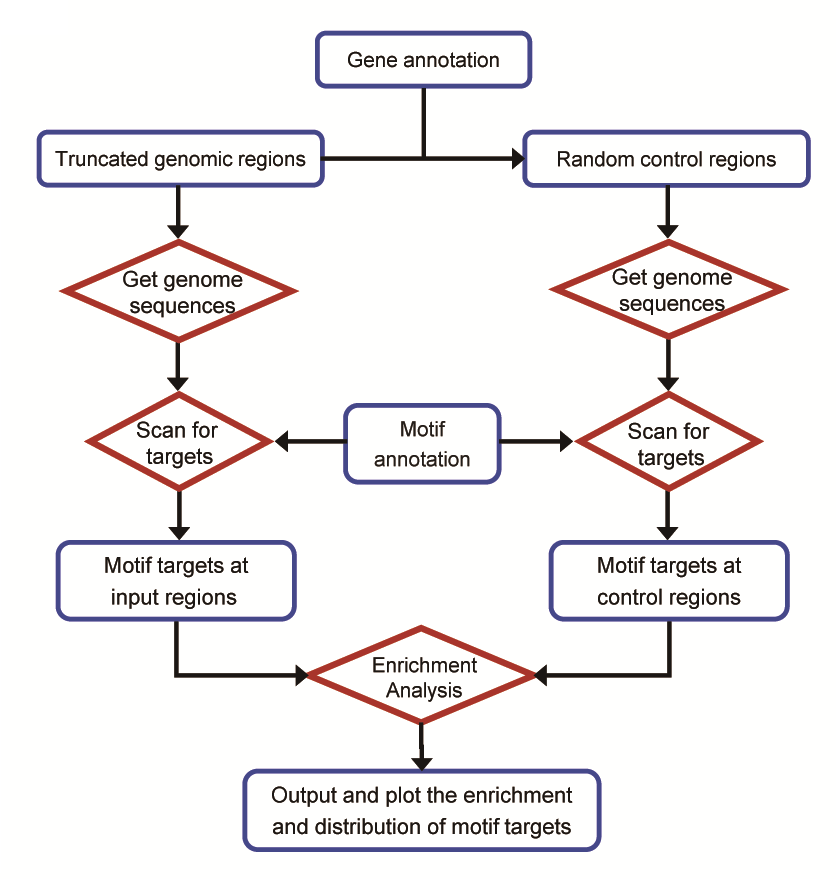
MotifScan is generally performed by 3 steps:
For the fisrt time running MotifScan: A common MotifScan procedure requires several data files (motif information, genome information and gene information), motif information and gene information are included in our packages. When you run the motifscan on the genome for the first time, a directory (.MotifScan) that storing above information will be created in your home directory. Under that directory, all the pre-compiled motifs and gene annotation are contained except the genome information.
Thus, you should specify the genome sequence file (.fa or .fasta) via option -G when you run the MotifScan for the first time to compile the genome information. After that, if you want to do MotifScan again on this genome, option -G can be omitted because the genome information has been stored under the .MotifScan directory.
Command Line
MotifScan -p Example/SL2548_Peaks.bed -m Example/motif_list_example.txt -g hg19_for_motifscan
Options
-p region file. |
MotifScan is occurred in the regions specified in this file. It is a customized bed format file. bed5col is default format, but you can also assign your region file format by option -f (see option -f for details) |
-g genome name. |
Now MotifScan pre-compiled the following genome, human, mouse, arabidopsis. You can specify other genomes by command MotifCompile |
-m compiled motif PWM. |
Motif matrix file including pvalue cutoff and perfect ratio. |
-f region file format. |
Default: bed5col MotifScan supports region files in 5 formats: 1. bed3col: a 3-column bed file, representing chromosome, start and end respecteively. It the simplest format containing least information. e.g. chr1 1711300 1711875 chr1 2179623 2180121 chr1 4717268 4717738 chr1 5285608 5286259 chr1 5327637 5327962 2. bed4col: a 4-column bed file, one more column representing region summit than bed3col. The summit value is the relative distance to the start site. e.g. chr1 1711300 1711875 288 chr1 2179623 2180121 249 chr1 4717268 4717738 235 chr1 5285608 5286259 326 chr1 5327637 5327962 163 3. bed5col: a 5-column bed file, one more column representing some statistics (like pvalue in MACS or mvalue in MAnorm) than bed4col. e.g. chr1 1711300 1711875 288 442.69 chr1 2179623 2180121 249 118.61 chr1 4717268 4717738 235 137.59 chr1 5285608 5286259 326 238.79 chr1 5327637 5327962 163 224.29 4. manorm: it is a manorm file usually with mvalue column. e.g. chr start end summit MAnorm Mvalue MAnorm Avalue MAnorm Pvalue common or unique chrY 2653916 2656315 1172 6.76 2.38 2.05e-15 H1hesc H3k4me3 Bro chrY 2709282 2711375 683 7.30 2.65 8.93e-23 H1hesc H3k4me3 Bro chrY 2801707 2804982 2024 7.15 2.57 2.05e-20 H1hesc H3k4me3 Bro 5. macs: it is peak file called by MACS, usually with pvalue column. e.g. chr start end length summit tags -10*log10(pvalue) fold enrichment FDR chr1 27644 30246 2603 1257 375 1609.14 19.29 0.14 chr1 540240 541130 891 516 24 59.25 6.12 10.98 chr1 712921 715877 2957 973 384 2813.05 46.96 0.10 chr1 761379 763880 2502 1094 332 2005.89 34.28 0.14 chr1 838832 839681 850 639 24 62.84 6.68 9.29 Basically, they are all bed files and bed3col, bed4col, bed5col format does not have the header line. |
-l motif_list. |
If specified, the program will perform scanning only on the given motifs. Otherwise, MotifScan will be performed on each motif provided in the compiled motif PWM file (specified by option -m). The motif list should be a subset of the available motifs from compiled motif PWM file, and the file should be organized as follows: e.g. Pou5f1 SOX10 ARID3A Prrx2 Sox5 NFIC Sox2 POU2F2 TEAD1 Sox3 ---EOF--- |
--o output directory. |
Specify the output directory. If the directory is not exites, program will create it. The default output value would be motifscan_output_[Prefix_of_input_region_file] |
Advanced Options
[enrichment analysis options]
-e enrichment flag. |
With this flag on, MotifScan program will only perform step 1, that is not scanning on the random control regions and not performing enrichment analysis. |
-s target site flag. |
With this flag on, MotifScan will report target sequence and absolute position of each motif |
-t gene annotation file. |
Gene annotation is meaningful for generating random controls in step 2. If all regions are in the promoter region, then we can picked up random regions just from the gene promoters instead of the whole genome. And it is believed that sequence characters on promoters are very differnt from those on whole genome. Thus, the gene annotation is an indispensable information. However, in most cases, you do not need really give the gene annotation file explicitly. When you specify the genome name via option -g, the corresponding gene annotation is automatically loaded unless you running MotifScan on your custom genome. |
--random_times. |
The number of times that picking up the random regions depends on the number f regions you provided. By default, it is 5 times. For example, you provided 1000 regions, then 5000 random regions will be generated. |
[search region options]
-r |
possible values: genome, promoter, distal genome: perform MotifScan on the all regions, the default. promoter: perform MotifScan on regions that only positioned at promoters distal: perform MotifScan on regions that only positioned at distals |
--promoter_up |
Only meaningful when option -r is promoter or distal. Define promoter regions: upstream distance to TSS. Default: 4000 |
--promoter_down |
Only meaningful when option -r is promoter or distal. Define promoter regions: downstream distance to TSS. Default: 2000 |
--region_length |
The region length around region summit. If summit is not provided in the region file, region midpoint is viewed as the summit. Default:1000 |
Result Interpretation
motif_enrichment.csv
All analyzed motifs are listed and sorted by enrichment p-value in the ascending order.
e.g.
| name | target number | rnd target number | fold change | enrich pvalue | deplete pvalue | pvalue corrected | |
|---|---|---|---|---|---|---|---|
| TAL1::GATA1 | 274 | 1214 | 1.12 | 0.033 | 0.971 | 0.067 | |
| TAL1::TCF3 | 269 | 1335 | 1.007 | 0.464 | 0.562 | 0.929 |
peak_motif_score.csv
The table can be divided into two parts, the first 5 columns are the region information part which briefly derived from the region file that user specified and the second part is the motif score information. Each motif has a score measuring the binding affinity for each region sequence.
e.g.
| chr | start | end | summit | value | ZNF263.ratio | GATA1.ratio | ... |
|---|---|---|---|---|---|---|---|
| chr1 | 3472492 | 3473222 | 3472752 | 64.52 | 0.83 | 0.34 | ... |
| chr1 | 3473390 | 3474130 | 3474005 | 54.19 | 0.73 | 0.07 | ... |
| chr1 | 4774018 | 4774765 | 4774578 | 52.82 | 0.84 | 0.62 | ... |
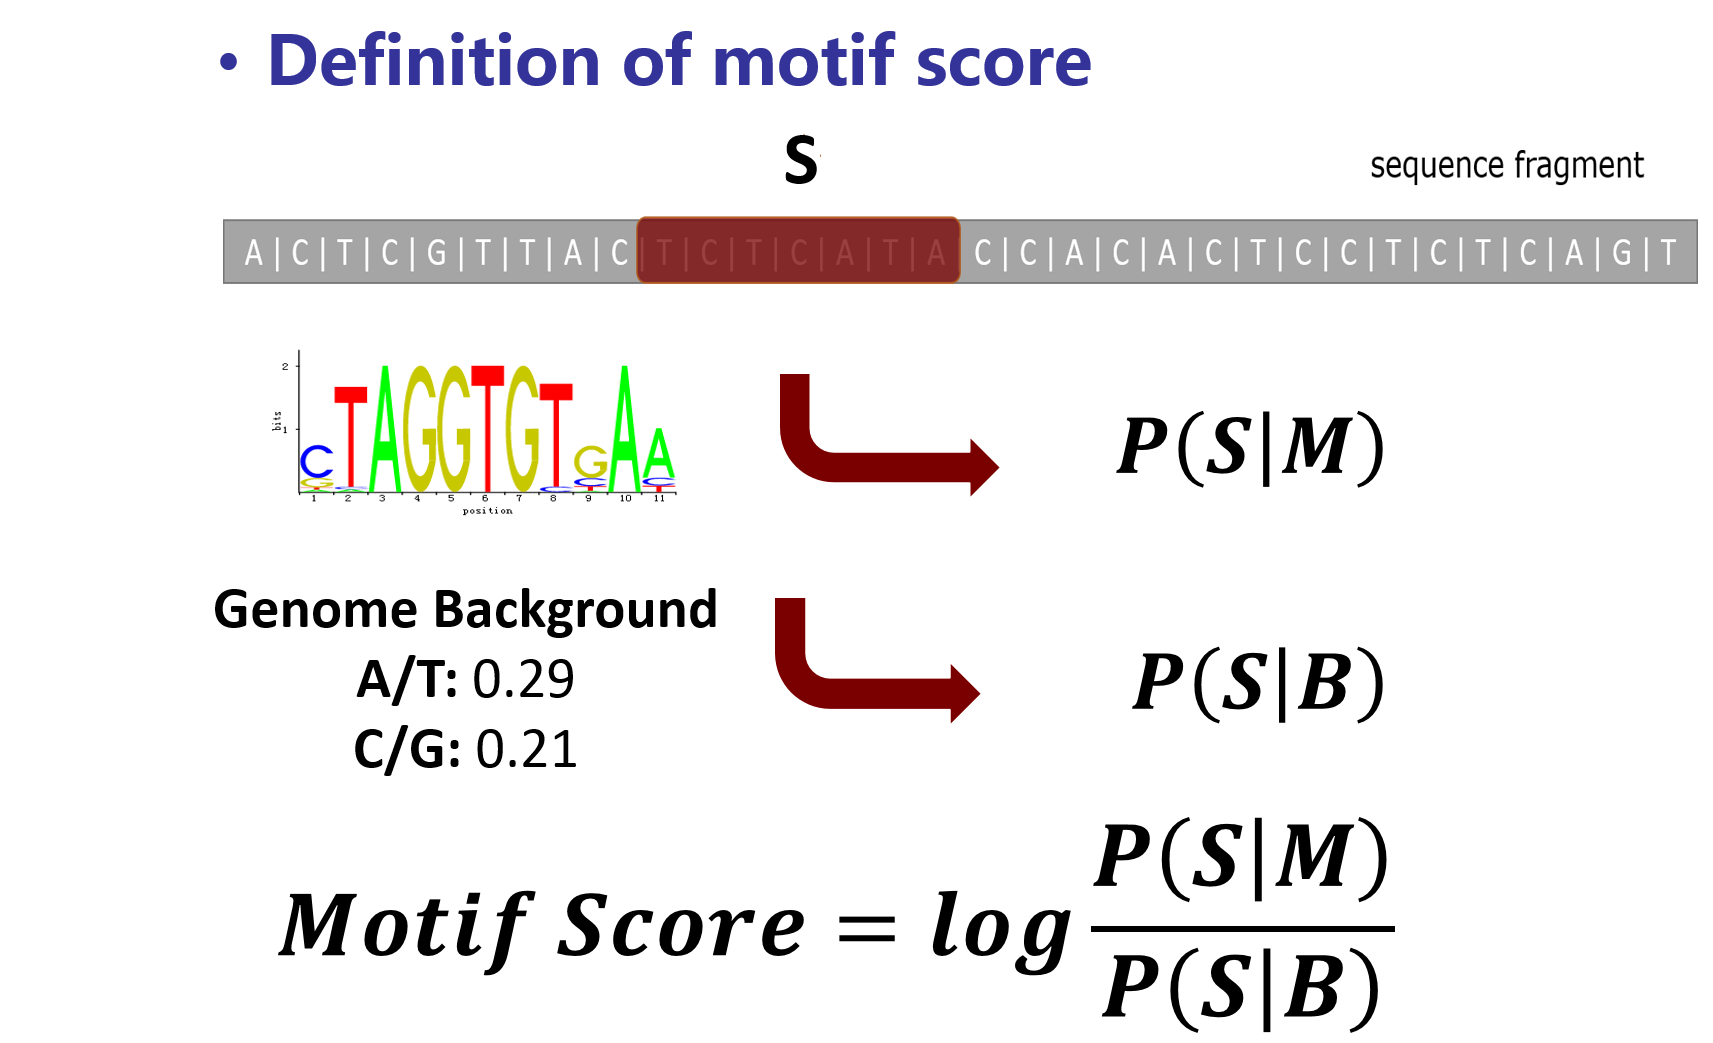
motif score is the measurement of the probability of the motif occurrence, that is the binding affinity of this motif on the site.
It is a also detail information table for each region’s motif target number for each motif. The file structure is similar to the peak_motif_score.csv, except the bold font represents the motif target number instead of the motif score.
e.g.
| chr | start | end | summit | value | ZNF263.tarnum | GATA1.tarnum | ... |
|---|---|---|---|---|---|---|---|
| chr1 | 3472492 | 3473222 | 3472752 | 64.52 | 3 | 0 | ... |
| chr1 | 3473390 | 3474130 | 3474005 | 54.19 | 2 | 0 | ... |
| chr1 | 4774018 | 4774765 | 4774578 | 52.82 | 0 | 1 | ... |
motif target sites/*
Only appears when option -s is on. The directory contains all the motif target site information of all candidate motifs. Each motif forms an independent file that named after [motif_name]_target_site.txt. The fisrt 3 columns are the motif target site coordinate on the genome. The 4th column is the corresponding target sequence and the motif score of the this motif occurrence is indicated in the last column
e.g. The motif target site of TAL1::GATA1
| chr | start | end | sequence | motif score |
|---|---|---|---|---|
| chr1 | 23684182 | 23684200 | ATTATCATTTCAGTGCAC | 0.57 |
| chr1 | 34861644 | 34861662 | CTGTTTCTGGAAGATATT | 0.54 |
| chr1 | 36020693 | 36020711 | CTGCATTCAACAGATACT | 0.56 |
| chr1 | 38519329 | 38519347 | CAGGATCAAGCTGATAAA | 0.54 |
| chr1 | 39419693 | 39419711 | CTTATCTTCTATCAACAG | 0.73 |
| chr1 | 53301859 | 53301877 | TTTATCTTCTAGTCCCAC | 0.58 |
| chr1 | 64197272 | 64197290 | CCTATCACGGGAGAACAG | 0.75 |
| chr1 | 64938769 | 64938787 | TTTATCTCCTCCCAACTG | 0.56 |
plot/*
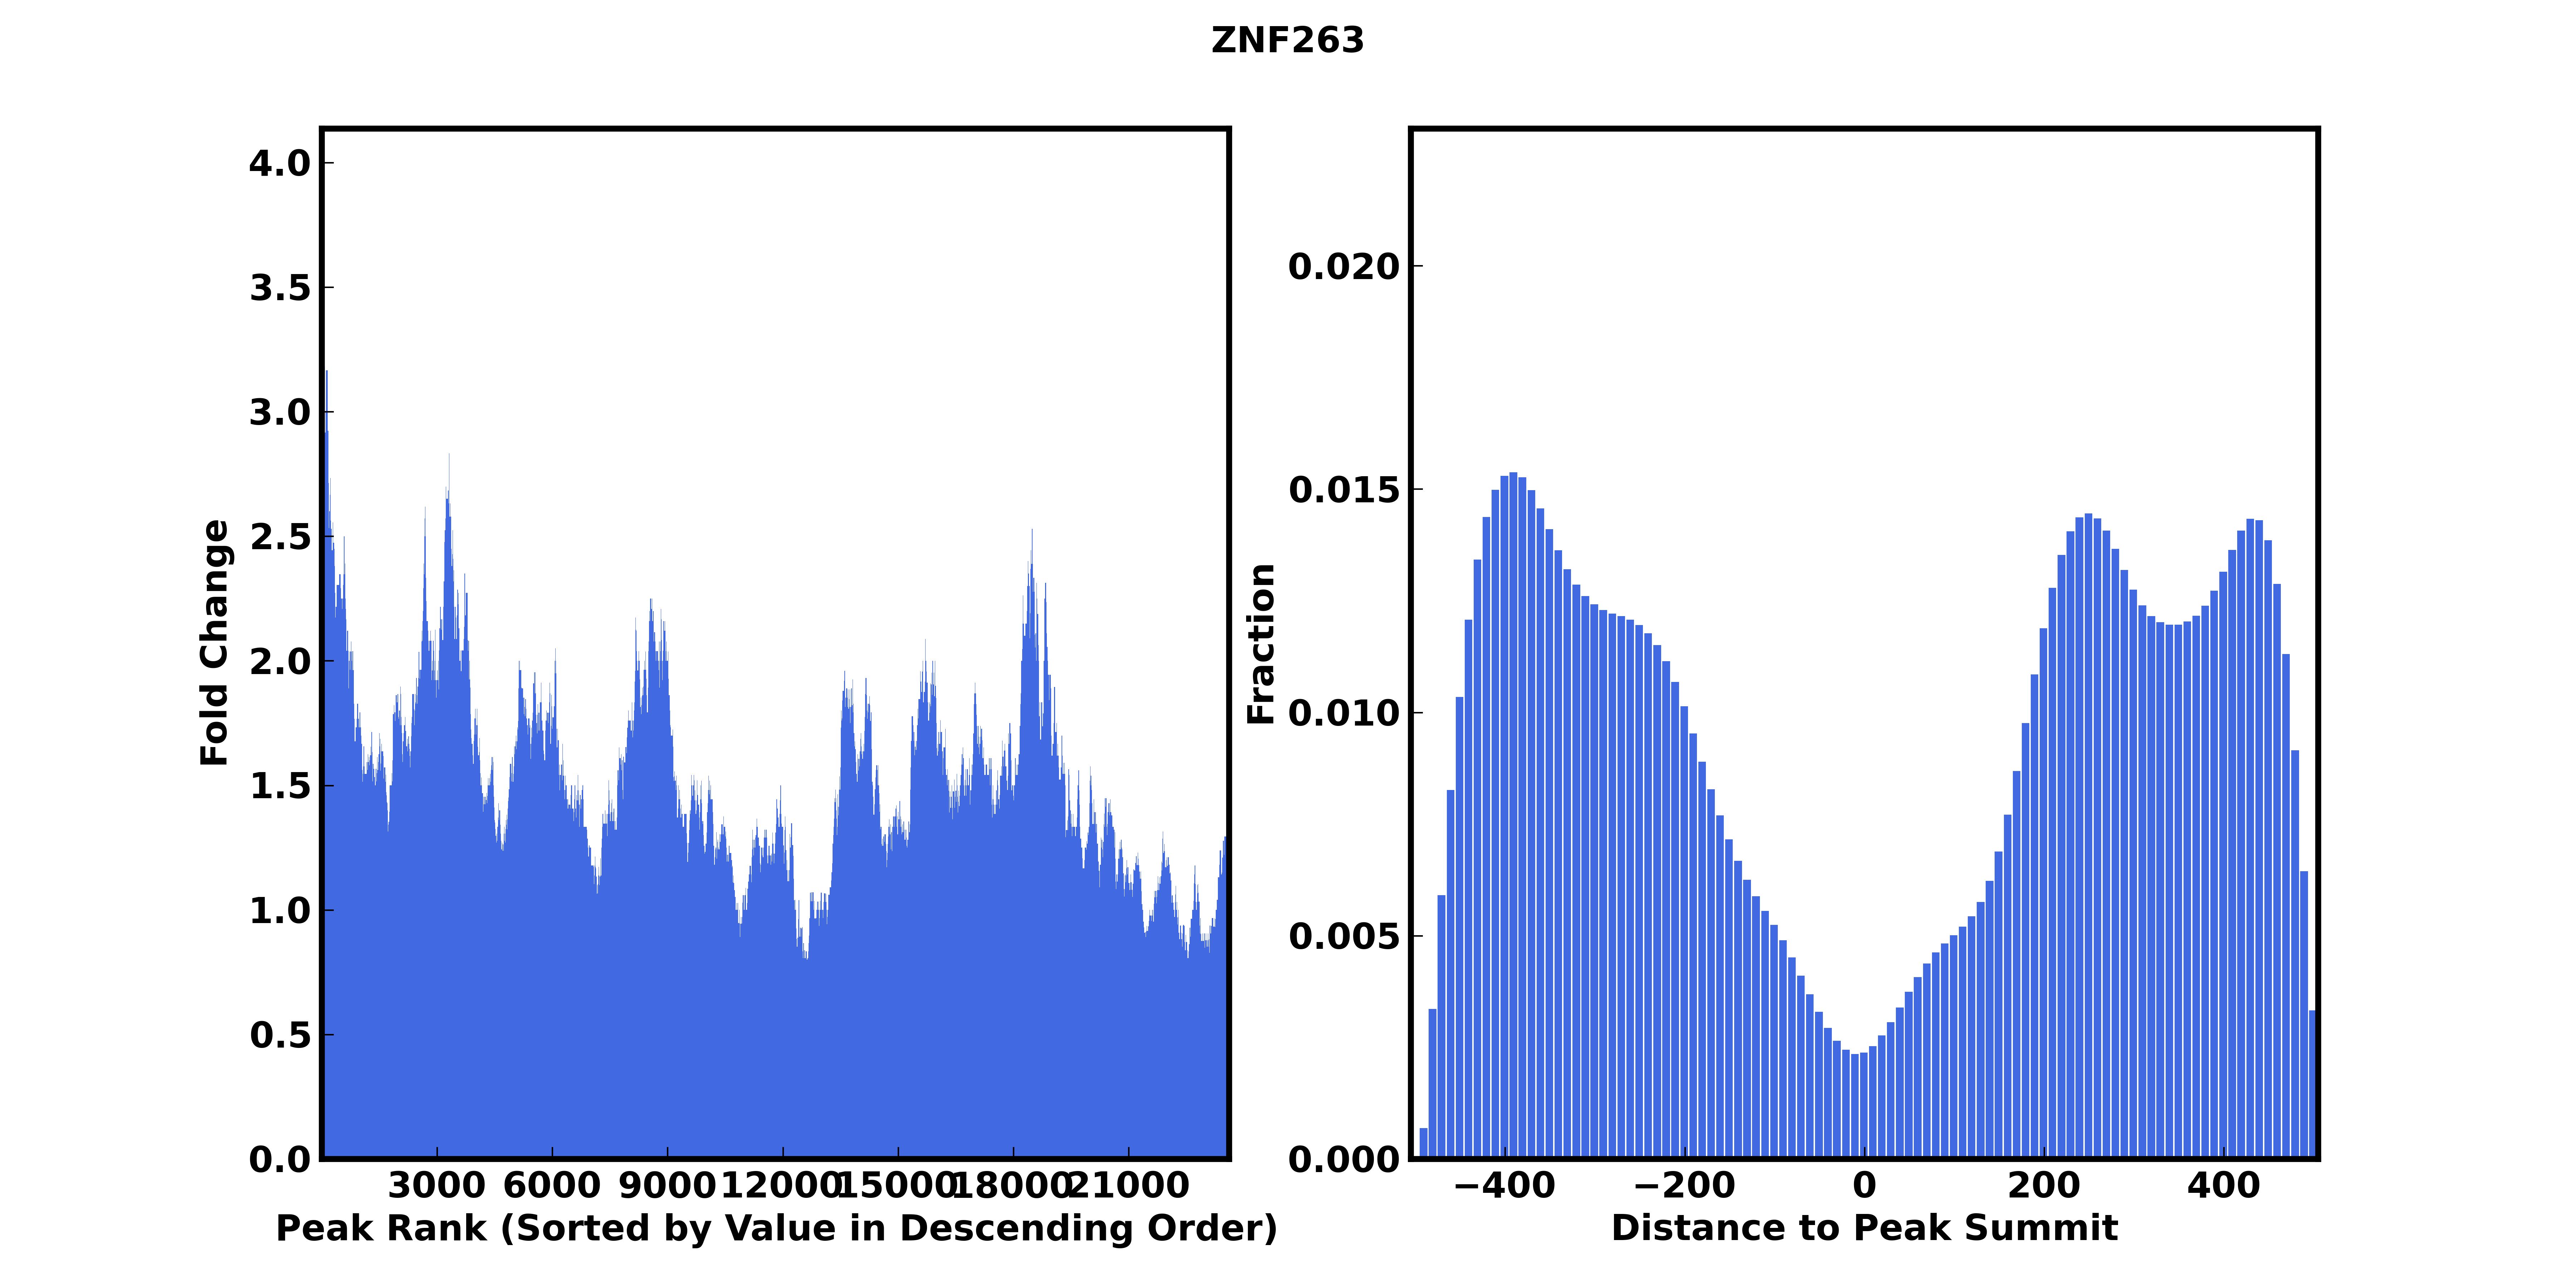
Under this directory, graphs for each motif will be generated.

MotifCompile
You can use MotifCompile to build your own motif and genome data. MotifCompile extracted 1 million regions from whole genome, and calculated motif score on for each motif on each region, this step is called simulation, which is usually time-consuming. Meanwhile, each motif's raw matrix are normalized, consensus sequence are generated, genome background and chromosome are calculated, which are essential information for our MotifScan task.
Command Line
MotifCompile -M Example/motif_pwm_demo.txt -g hg19_for_motifscan
4.2 Options
-g precompiled genome directory |
the directory generated by GenomeCompile |
-M motif PWM file. |
The matrix should follow the JASPAR raw motif matrix format, that is: each motif id followed by a motif name (separated by tab), they are in a line started by '>' and the matrix is like this: 3976 1495 0 13819 0 0 0 0 10453 0 2184 2073 4490 13819 0 4863 0 0 0 745 9929 6633 7125 1909 0 0 1370 13819 0 13819 2568 729 455 645 5925 0 0 7586 0 13819 0 53 3161 4547 4 rows represent A, C, G, T while columns represent the base positions, elements are separated by tab. |