3 Result
3.1 Main Result
3.1.1 Introduction
The major result of GSHR is Expression Enrichment. The Expression Enrichment helps to find the most related transcriptomic studies to the input gene list. GSHR collected up- and down-regulated gene sets based on pair-wise comparisons from avaliable transcriptomic studies. If the input gene list is highly enriched in the pre-defined up- or down-regulated gene sets, the hormones and hormone-related factors potentially regulating the input gene list will be returned. The detailed descriptive and statistical information about the comparisons are also presented.
3.1.2 Result Interpretation
The Expression Enrichment result summary is present and you can click the link of Input Unique Gene Annotation to get all gene annotation of input gene list. Enriched studies are listed and ranked by P-value from low to high. You can click the sorting tags in front of each column to gain the sorted result you want. Selecting the checkboxs of the studies can do the further analyses of the genes enriched in the studies. The process to do further analyses presents as follows. You also can click the reset button to reselect the enriched studies.
3.2 Further Analyses
We provided the cluster analysis, co-expression network, KEGG, GO and InterPro enrichment for further analyses, the results were respectively showed as follows.
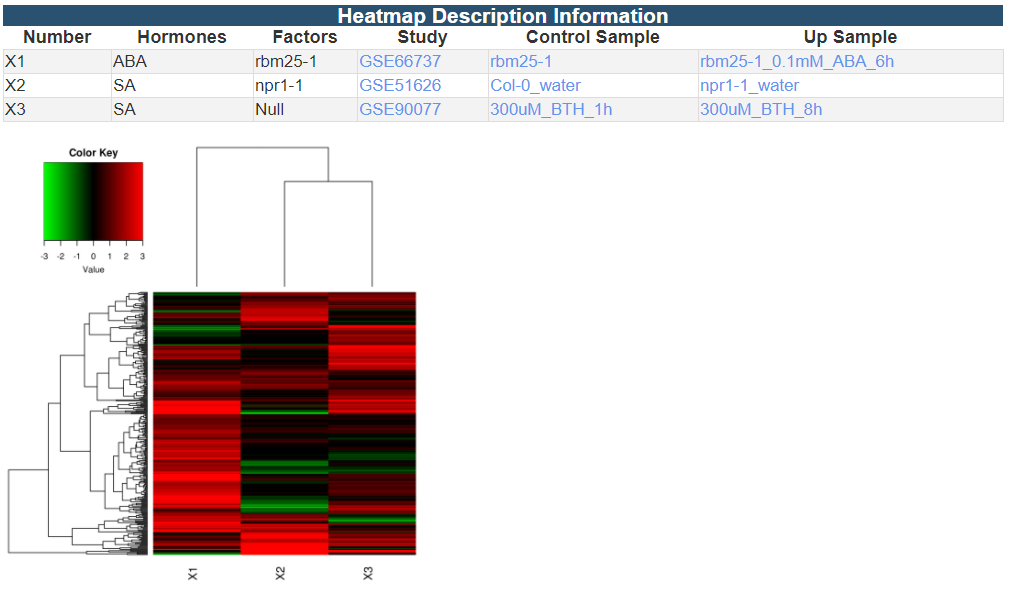
3.2.1 Cluster Analysis
3.2.2 Co-expression Network
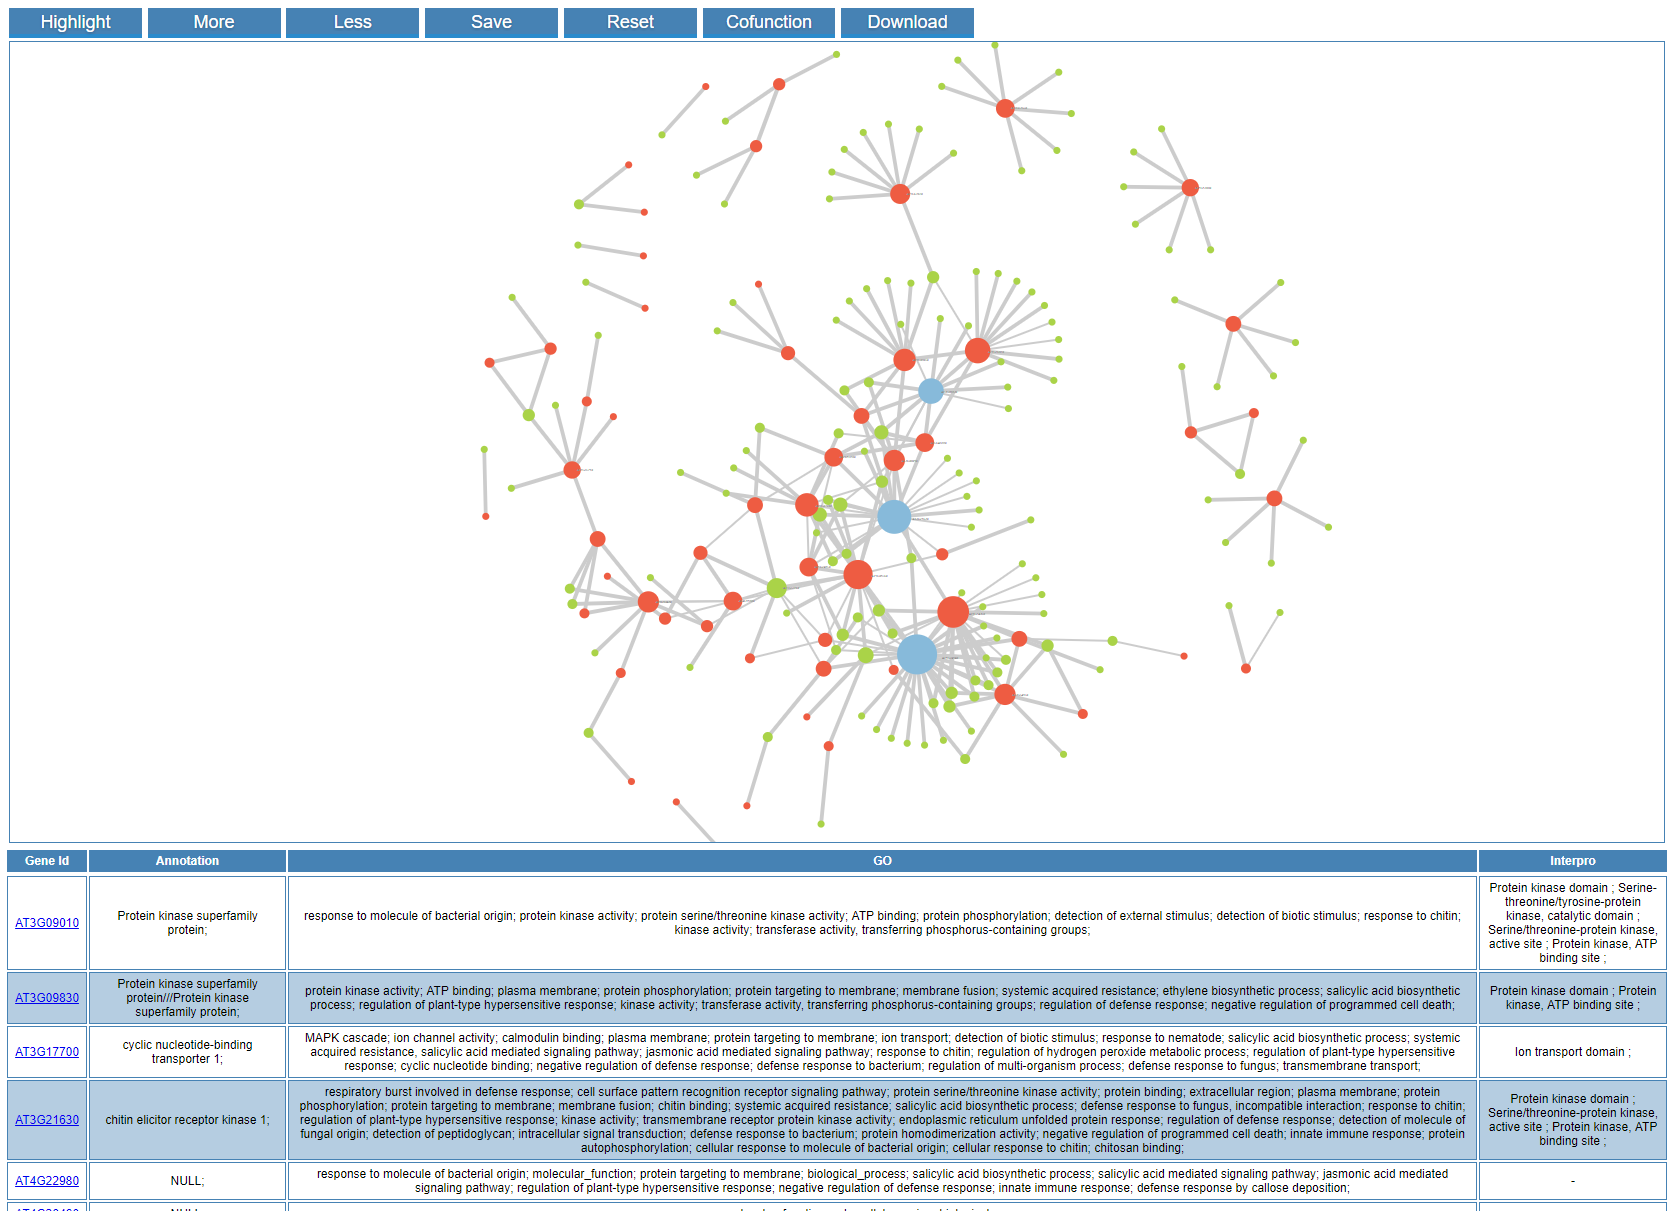
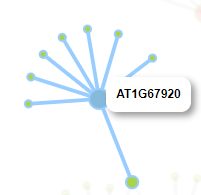
We constructed the co-expression network to search for the potential co-regulators of given genes. Pearson correlation coefficient was used to measure the tendency of co-expression. Notably, each pair of co-expressed genes are connected by an edge, which is highlighted in blue if they share common functions, indicating relatively strong evidence for co-regulation between the pair of genes linked.
3.2.2.1 Arguments
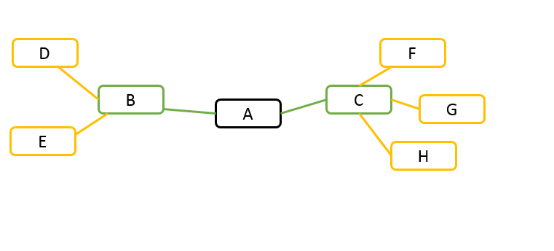
Search Depth: the maximum distance between two co-expressed genes.
For example, given gene A in the following diagram. If search depth is 1, all genes have correlation coefficients above the cutoff with gene A are presented, such as gene B and gene C. If search depth is 2, in addition to gene B and gene C, genes co-expressed with gene B and gene C are also presented.
Correlation Coefficient: the cutoff of co-expression, and values above this cutoff are presented in the result.
3.2.2.2 Result Interpretation
An interactive co-expression network will be generated by GSHR. Each pair of co-expressed genes are connected by an edge, which is highlighted in blue if they also share common functions, indicating relatively strong evidence for co-regulation between the pair of genes linked. The functions of buttons in the result page list as follows :
| Highlight |
Highlight the input genes in the network |
| More |
Show more gene names |
| Less |
Show less gene names |
| Save |
Export the network graph in svg format |
| Reset |
Reset the graph to the initial status |
| Cofunction |
Highlight the co-function relationship |
| Download |
Download the correlation coefficient table |
When you click the node in the network, it would be highlighted in the network. Meanwhile, the corresponding row in the gene table is also highlighted and vice versa. In addition, you can zoom in/out and drag the graph by your mouse.
When you hover the pointer over one node, its neighbor nodes will be highlighted.
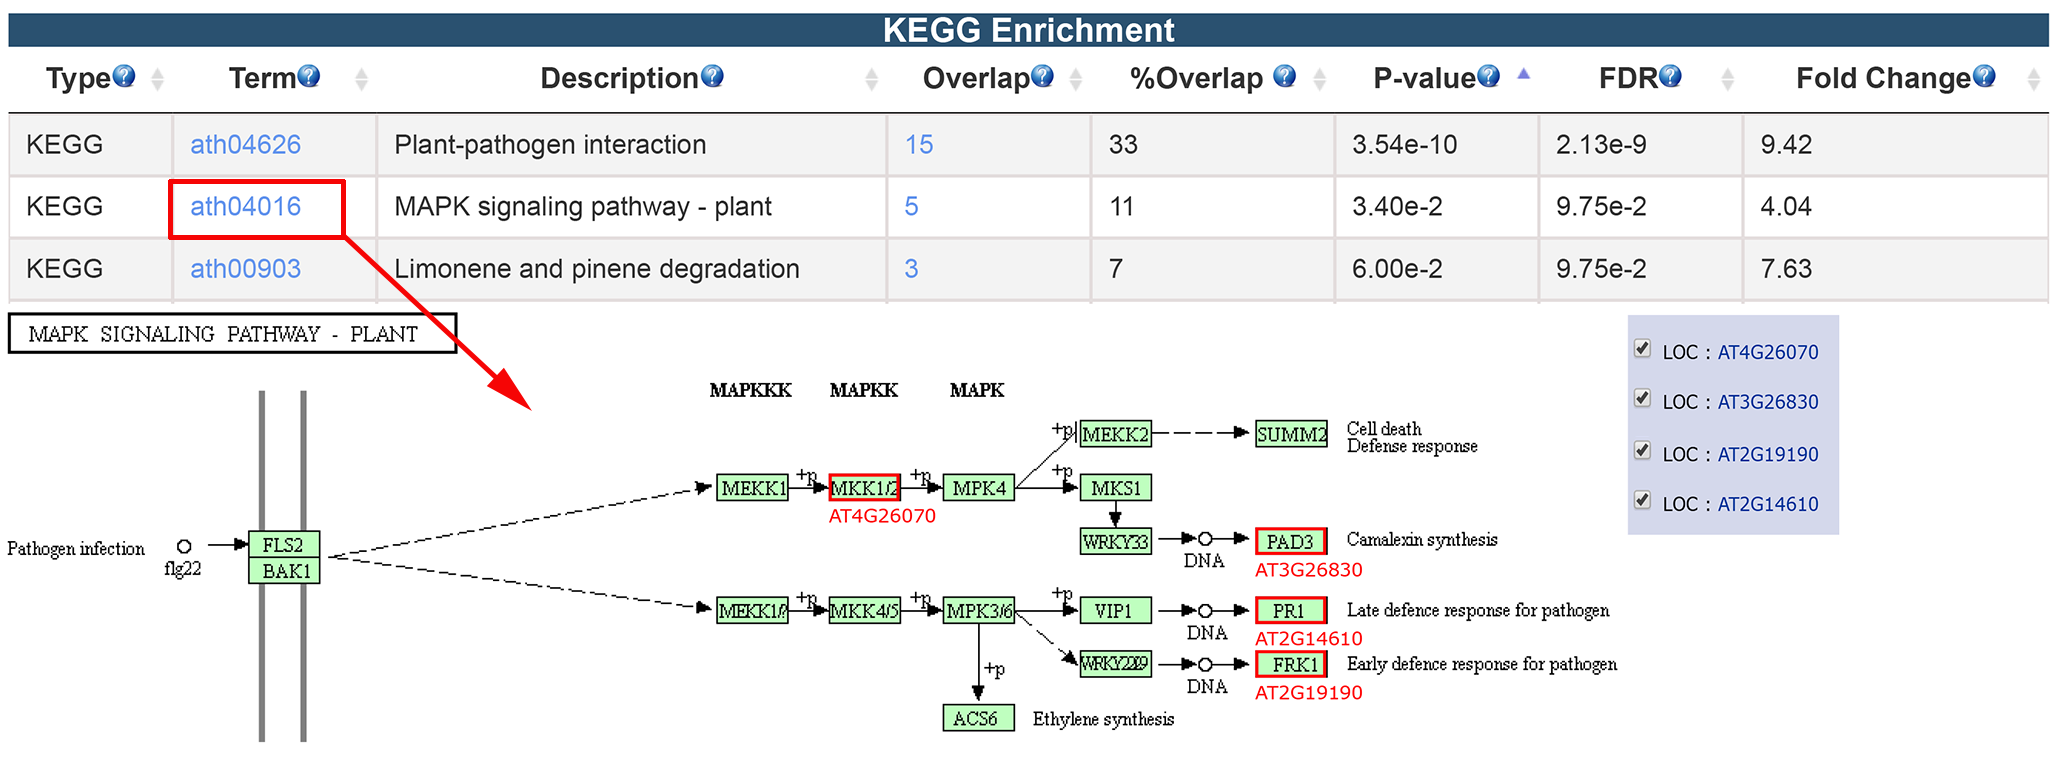
3.2.3 KEGG, GO and Interpro Enrichment
The results of KEGG, GO and Interpro enrichment are given in a similar way. Specifically, the result page of KEGG enrichment provides a link to the pathway graph where the input genes are highlighted. We only presented the KEGG enrichment result here.