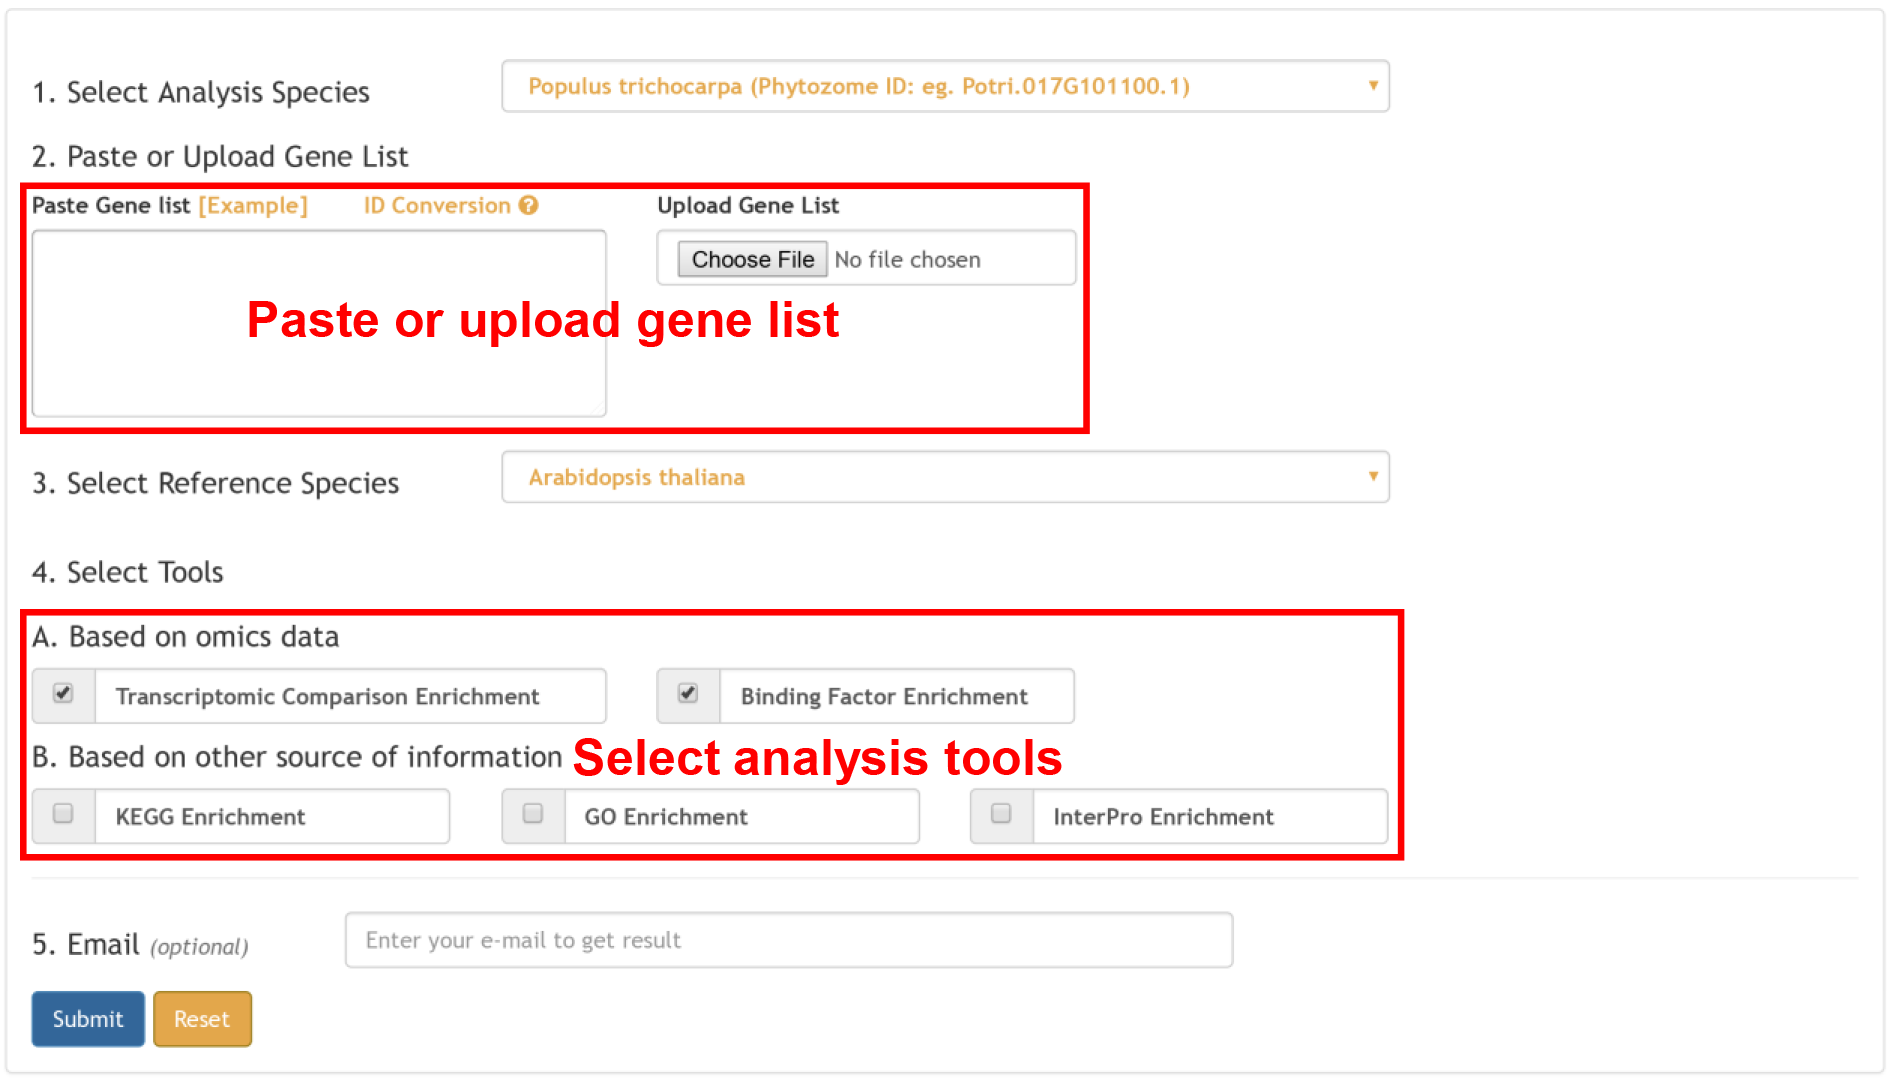
For single gene input, Plant Regulomics provides 4 types of information:
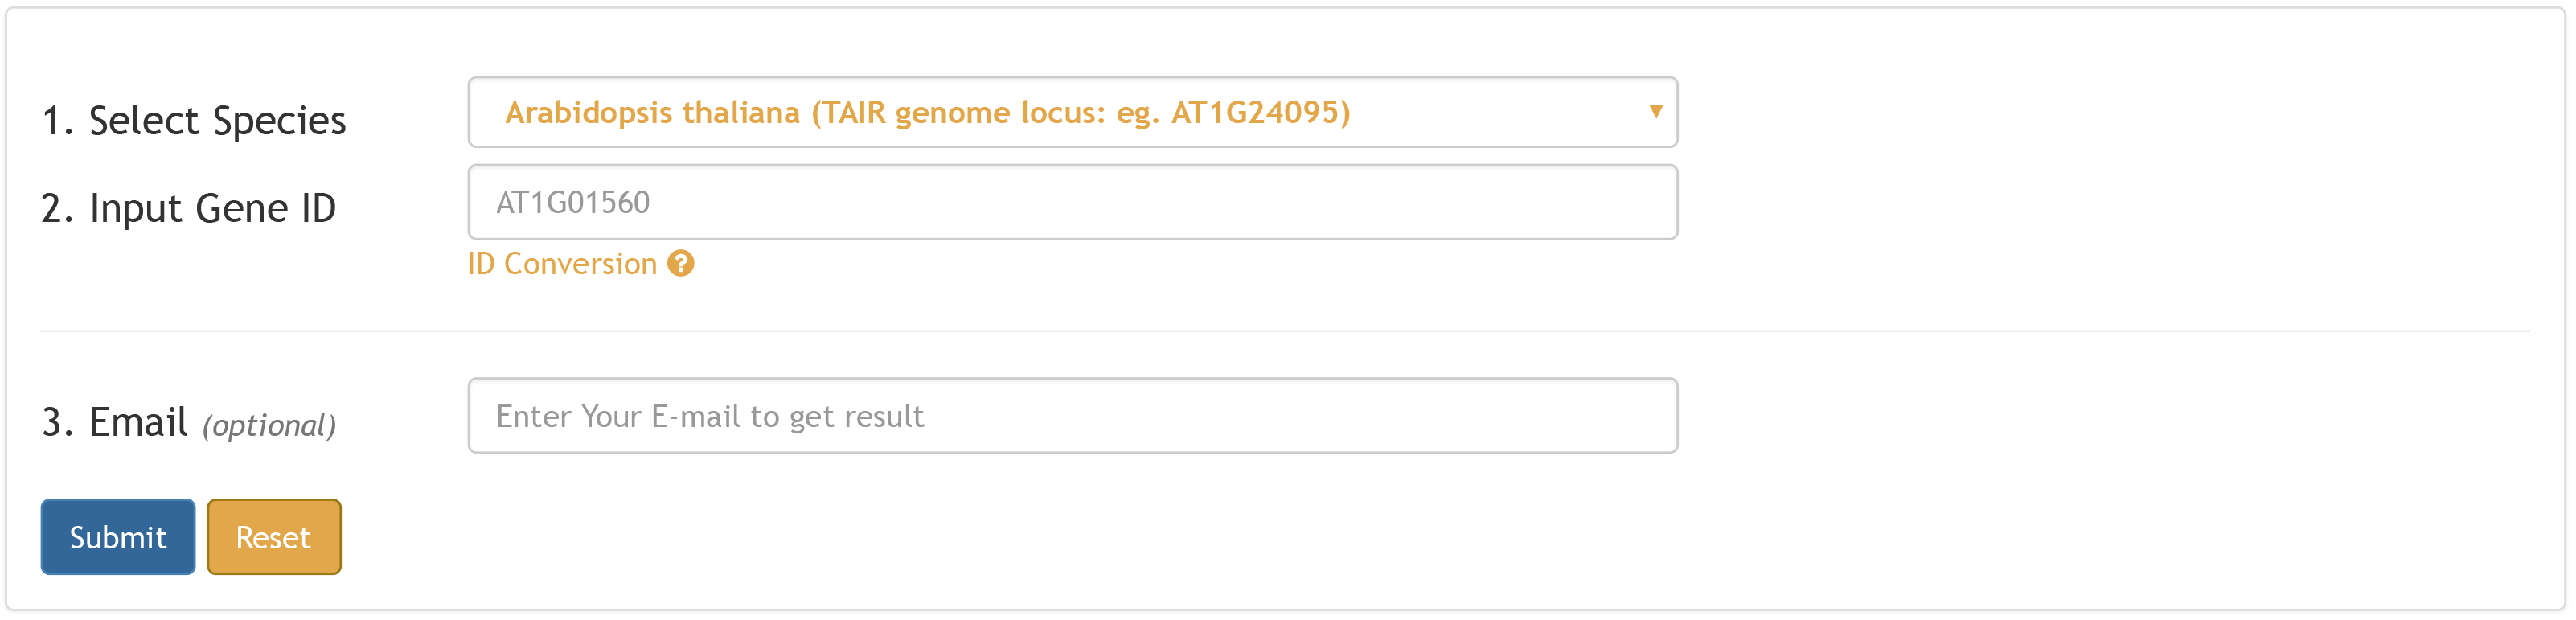
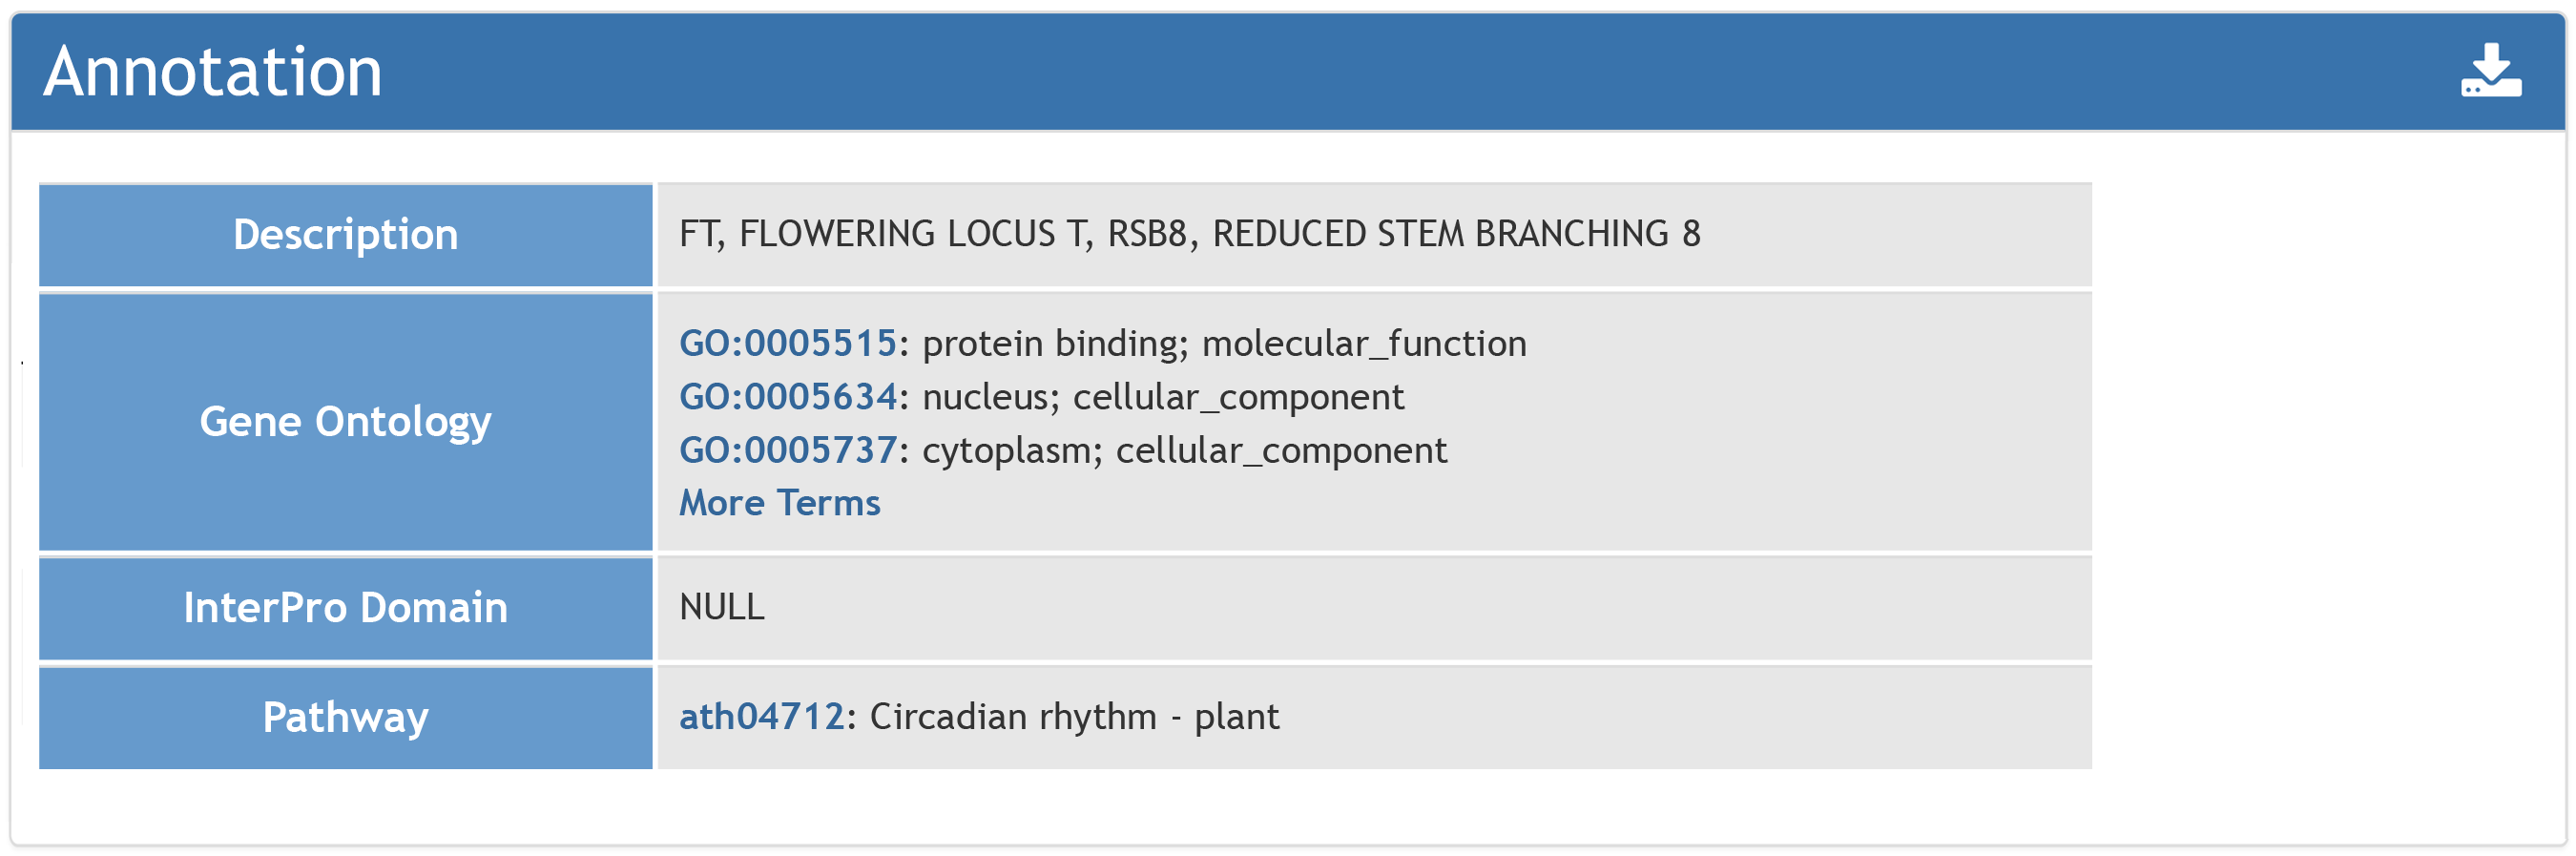
1. Summary information of the input gene.
2. Transcriptomic comparisons affecting the input gene.
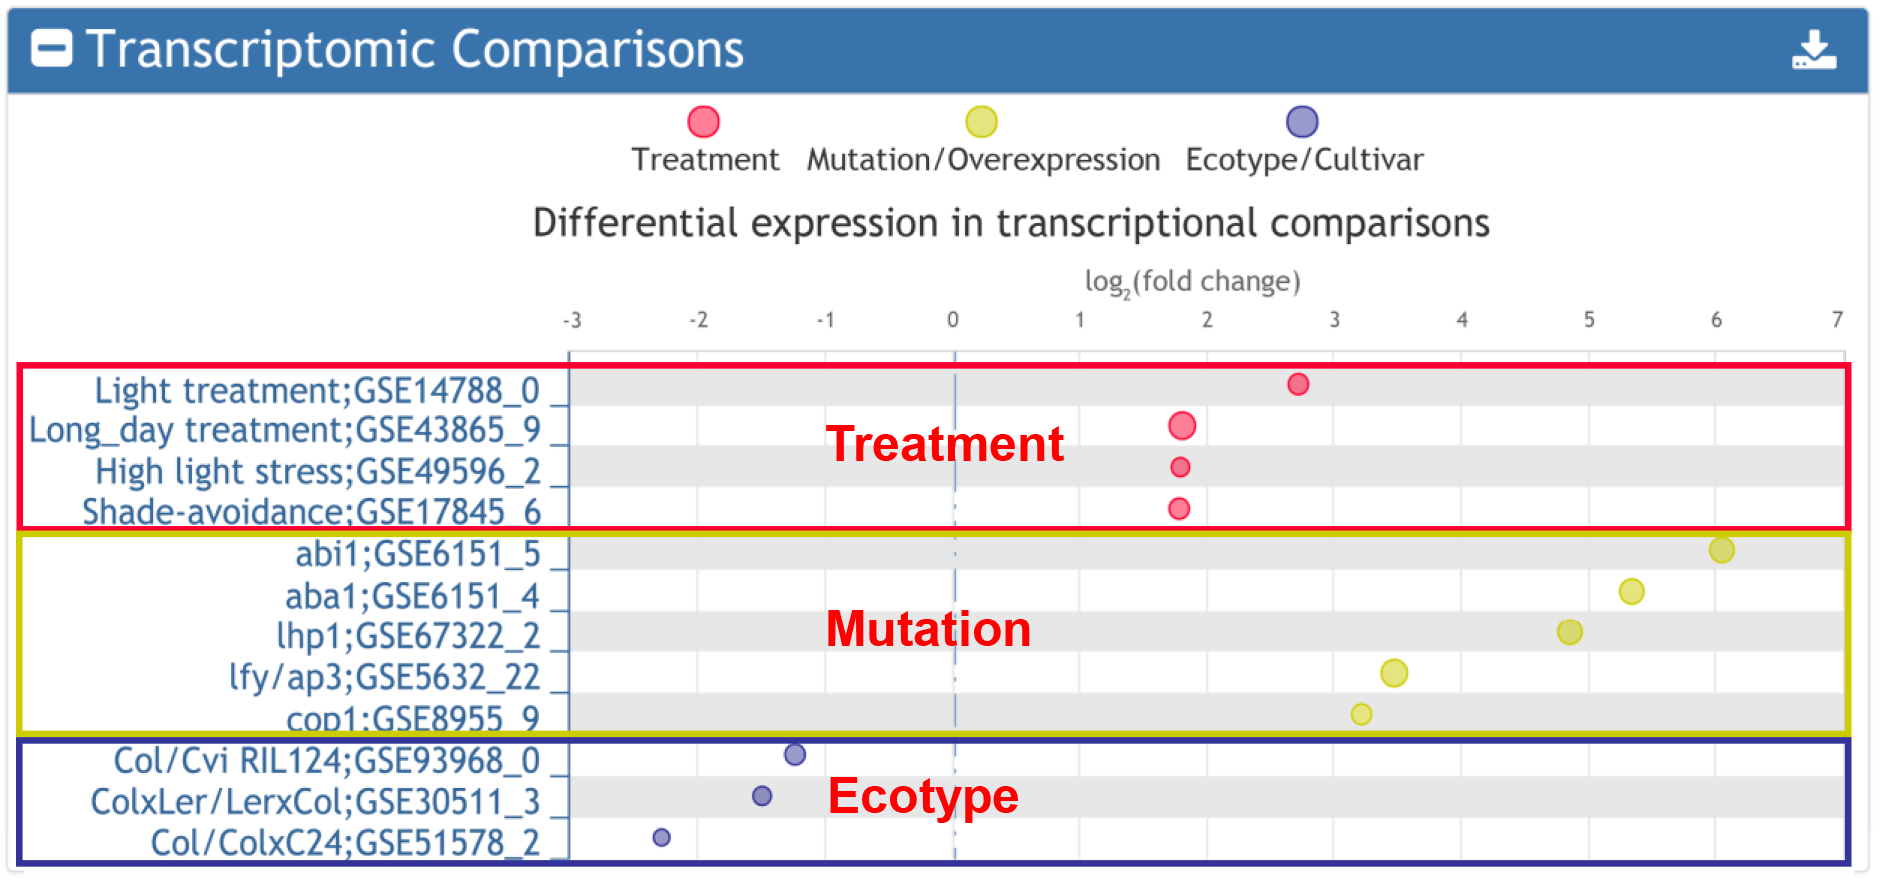
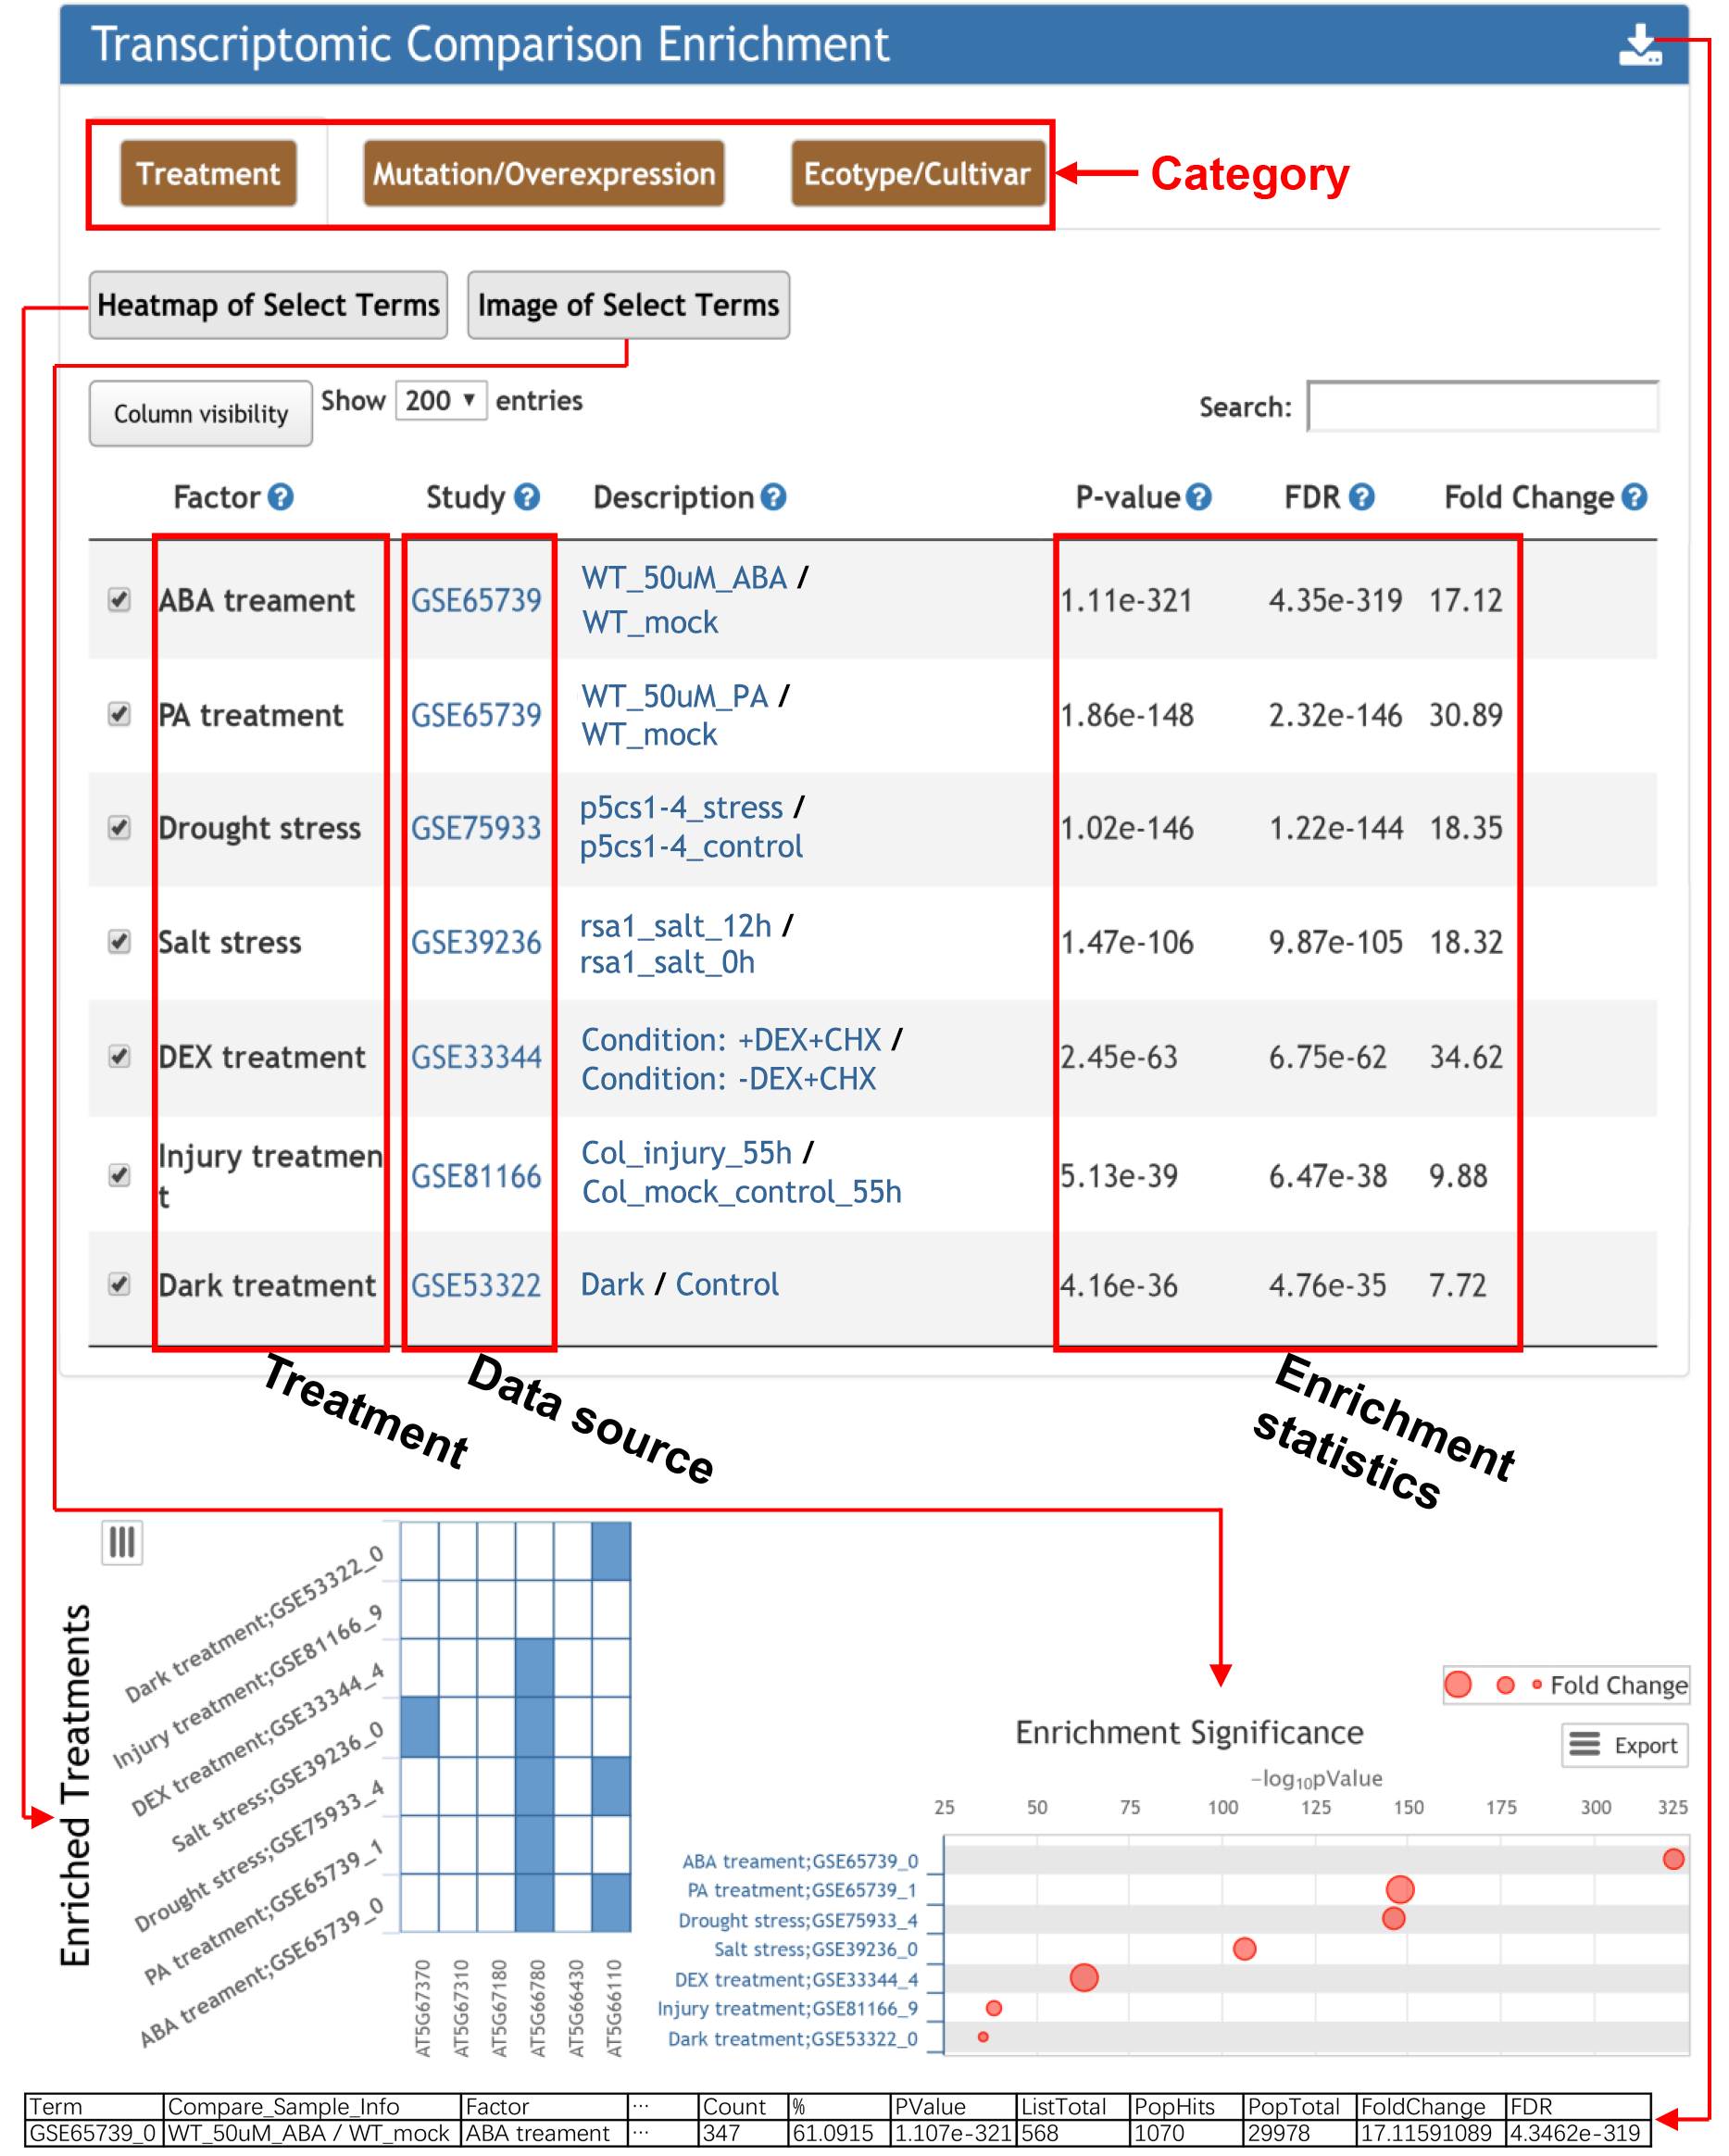
The database collected 10,750 differentially expressed gene sets, which were manually grouped into three categories, namely treatment, mutation/overexpression, and ecotype/cultivar. For any input gene, the transcriptomic comparisons affecting the input gene are returned. Detailed information of each term can be obtained by clicking the corresponding links.
3. Motifs present around input TSS regions.
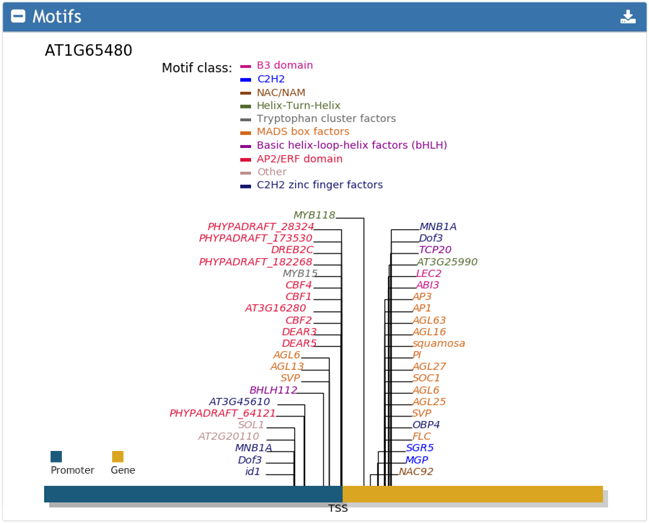
The motifs were downloaded from JASPAR. Motif search was performed using MAmotif.
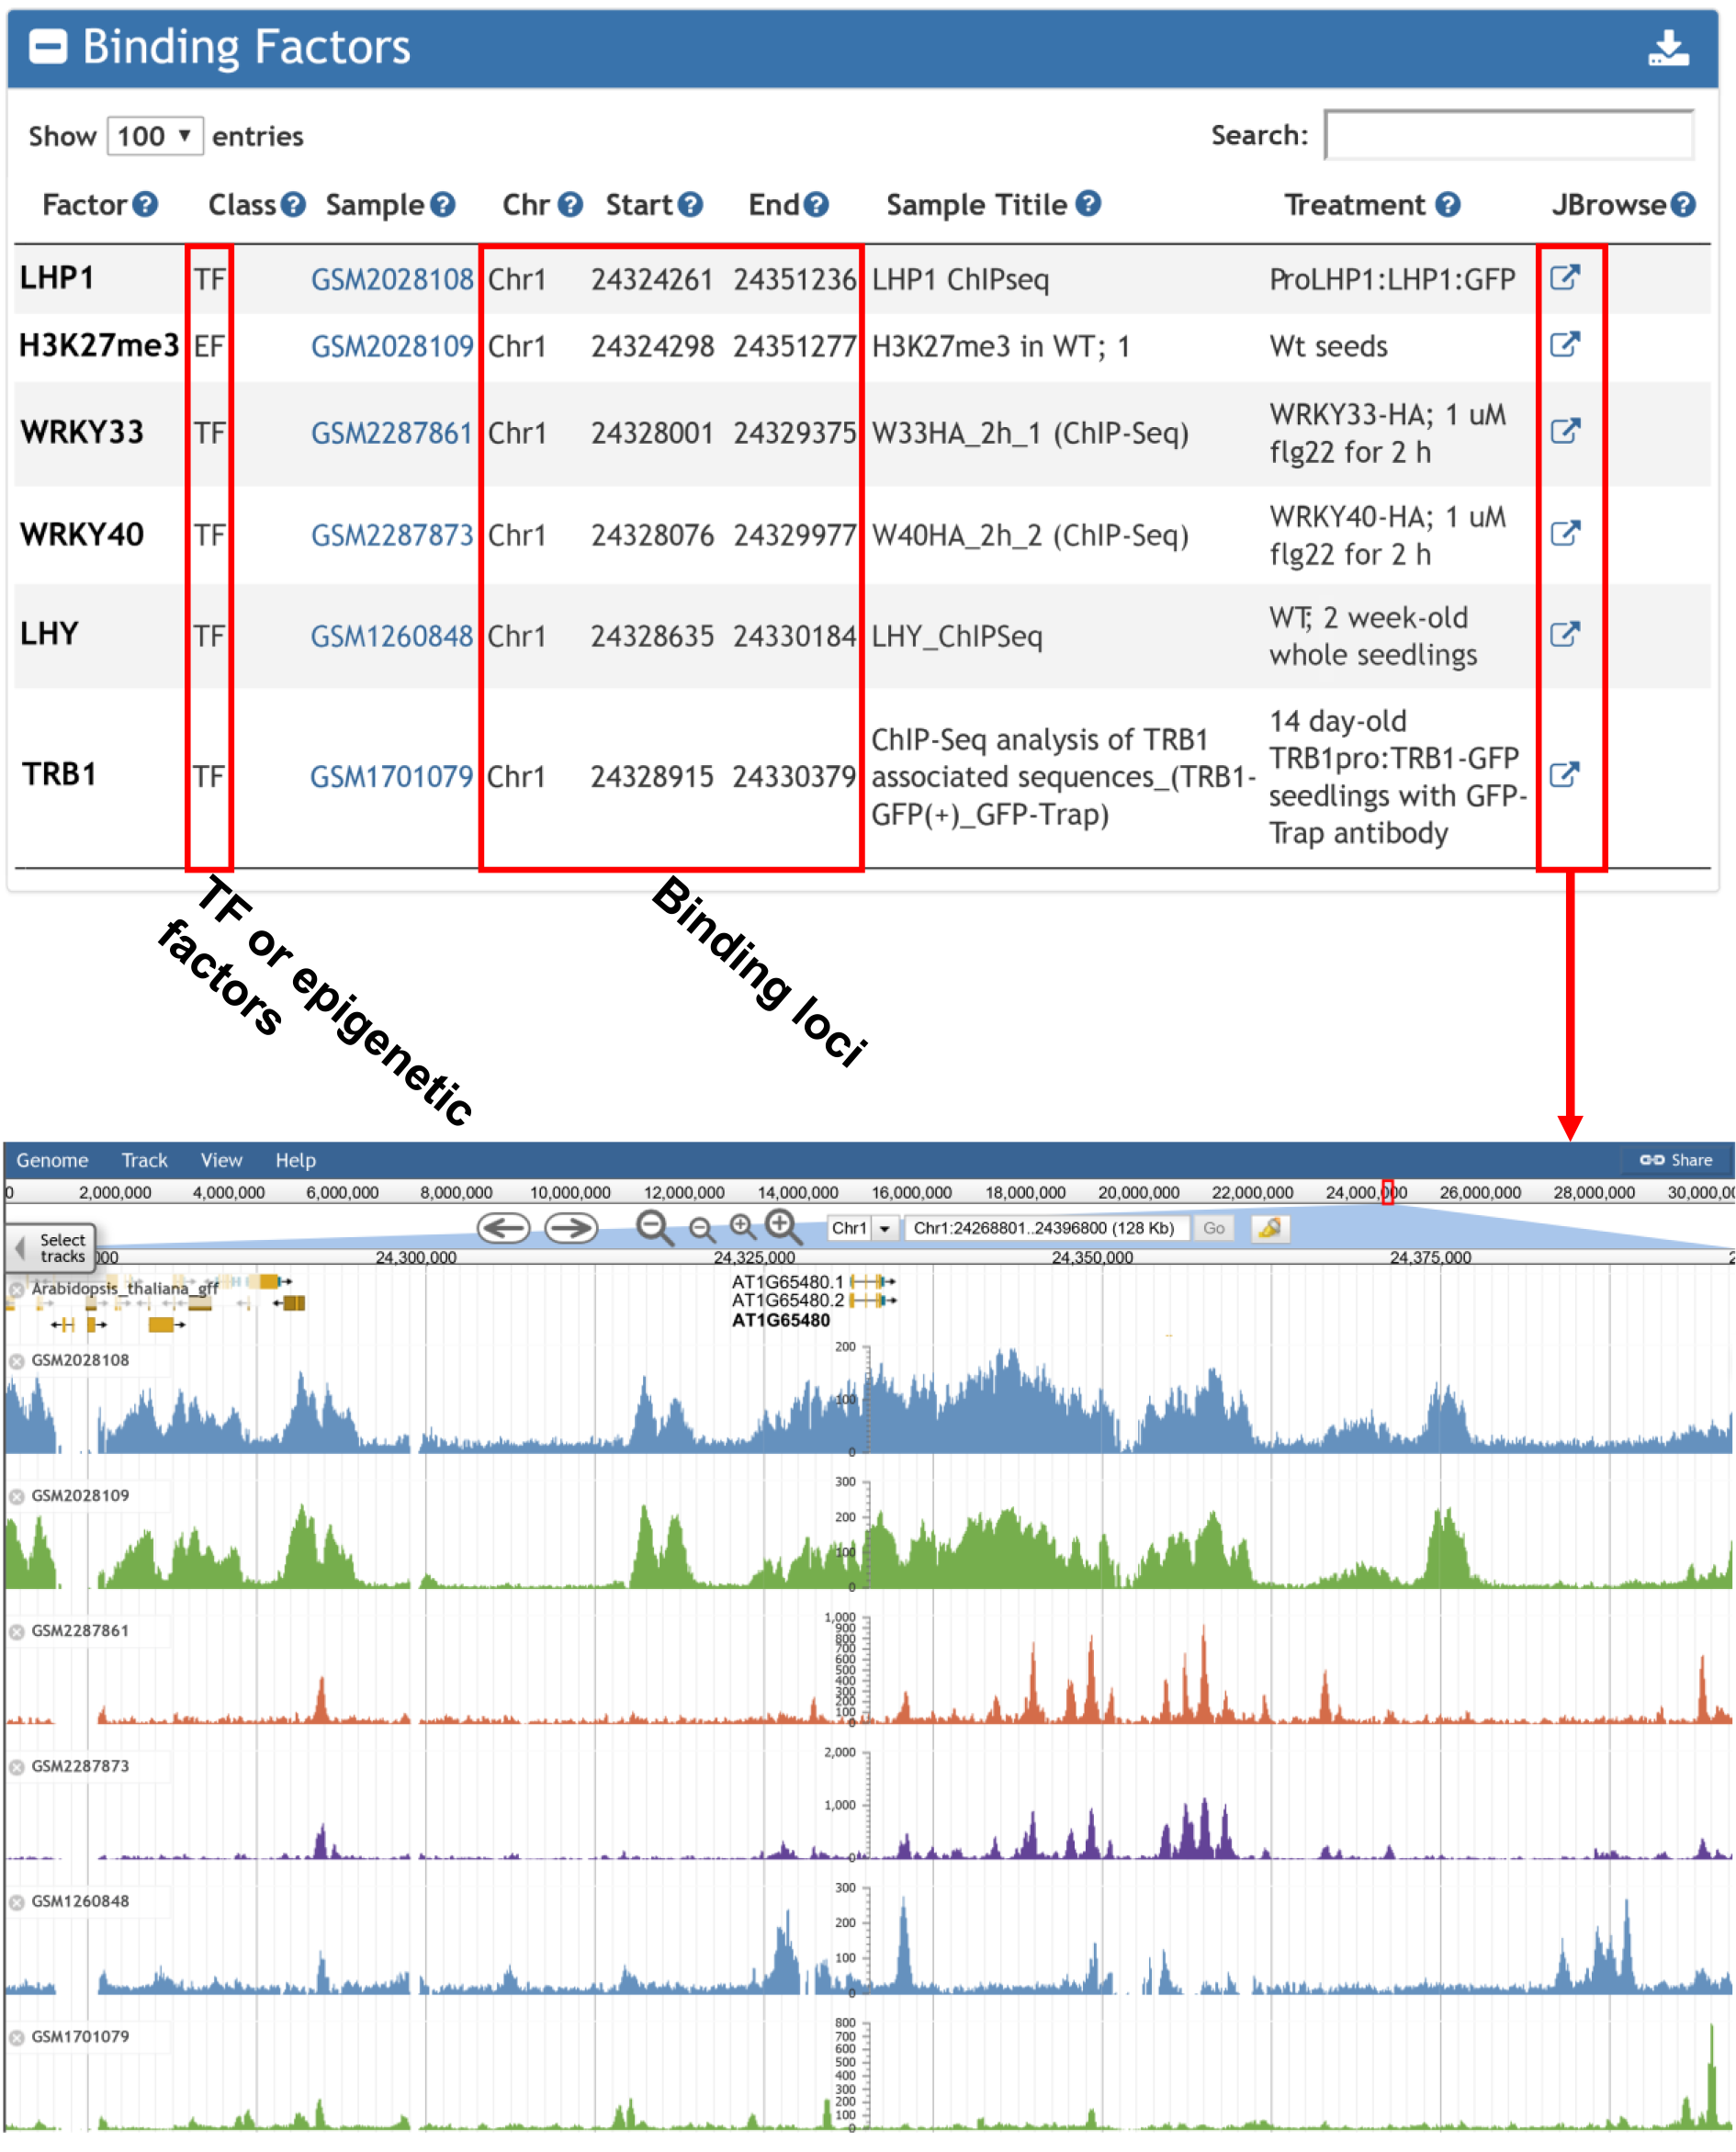
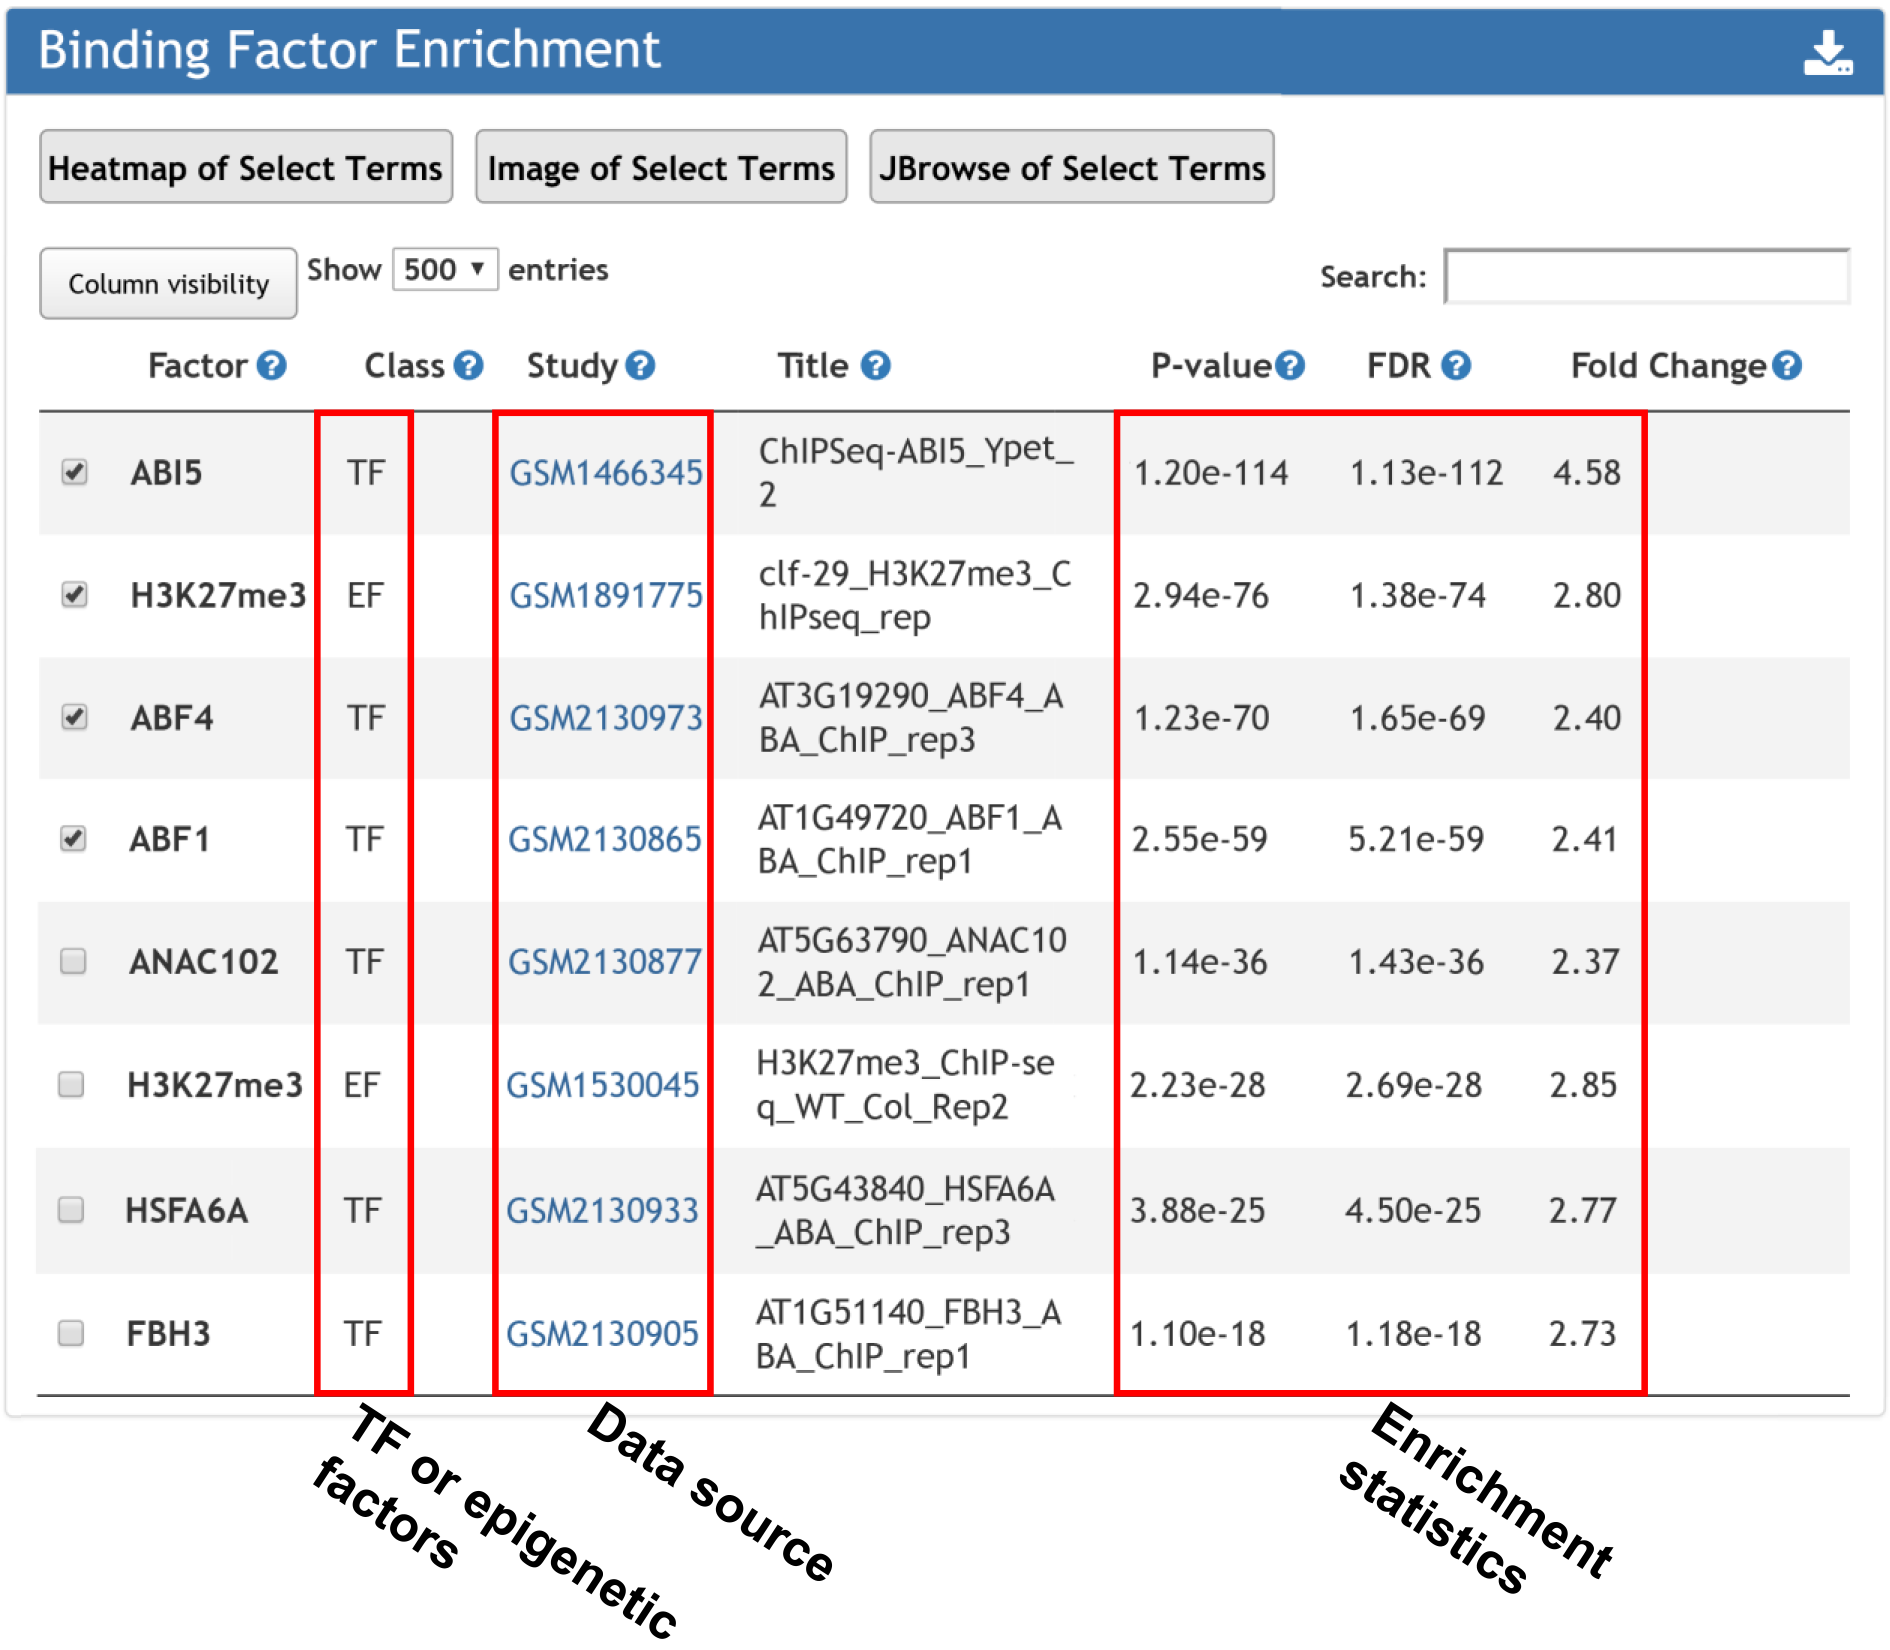
4. Transcription and epigenetic factors enriched at the input gene determined by ChIP-seq.
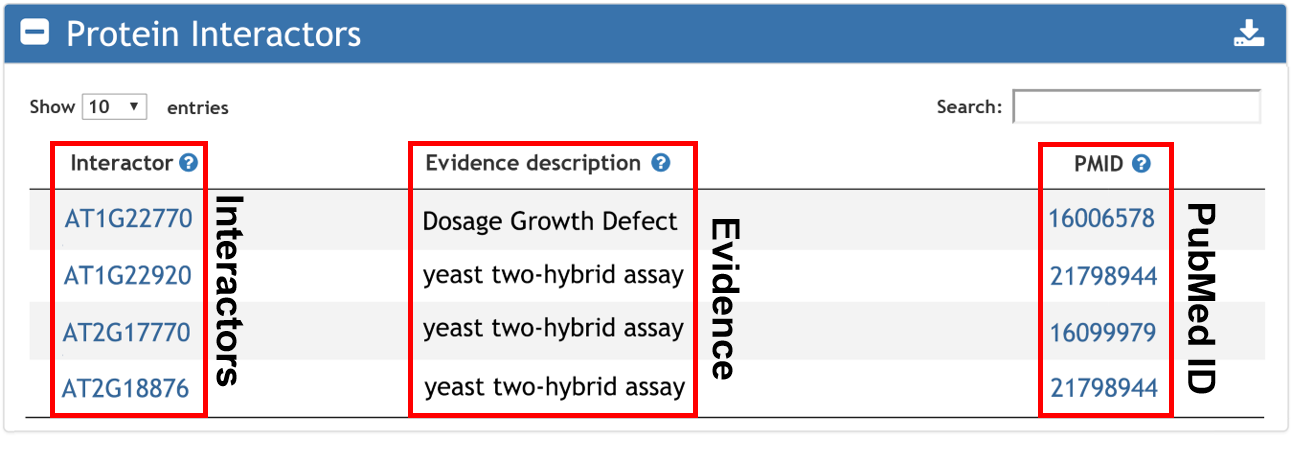
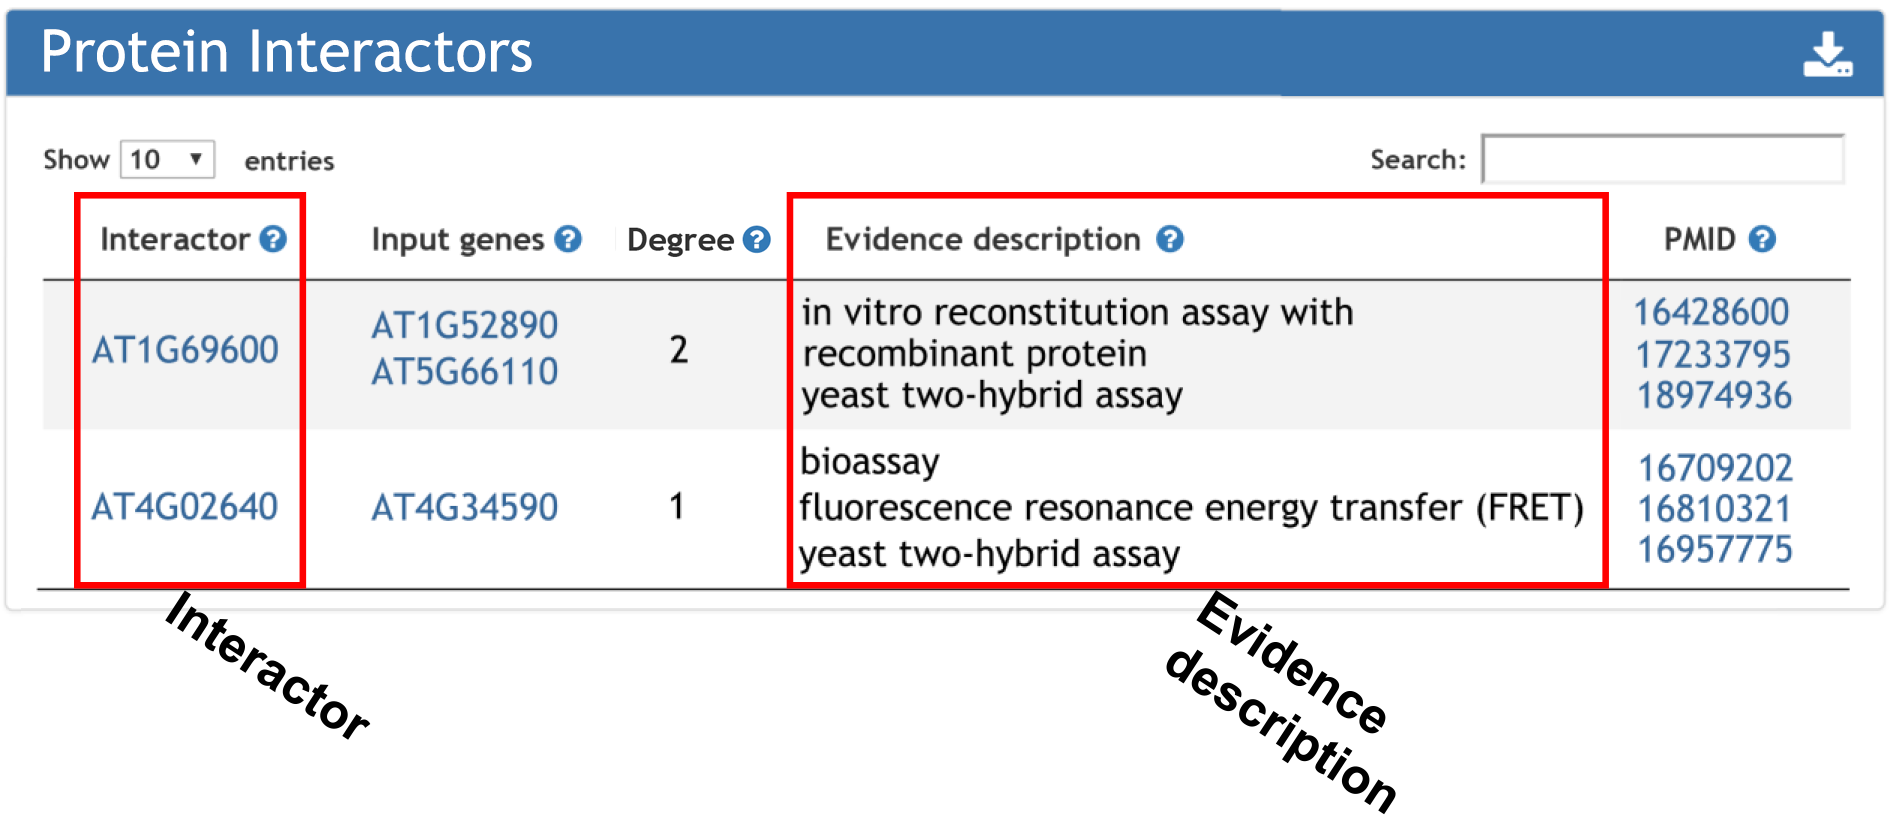
5. Interactive proteins with input gene.

For transcriptomic comparison enrichment analysis, 10,750 differentially expressed gene sets were manually grouped into three categories, namely treatment, mutation/overexpression, and ecotype/cultivar. A modified Fisher's exact test (Huang et al., doi: 10.1093/nar/gkm415) was used for the enrichment analysis, testing whether the input gene list have significant overlap with the gene sets in the database. The enrichment result was presented in the table sorted by P-value. Visibility of different columns of information could be selected by clicking the visibility button. Detailed information about whether the expression of a given gene displayed significant changes in the transcriptomic comparison in the table could be further plotted in a heatmap. Enrichment plot could be generated either sorted by P-value or by fold change.
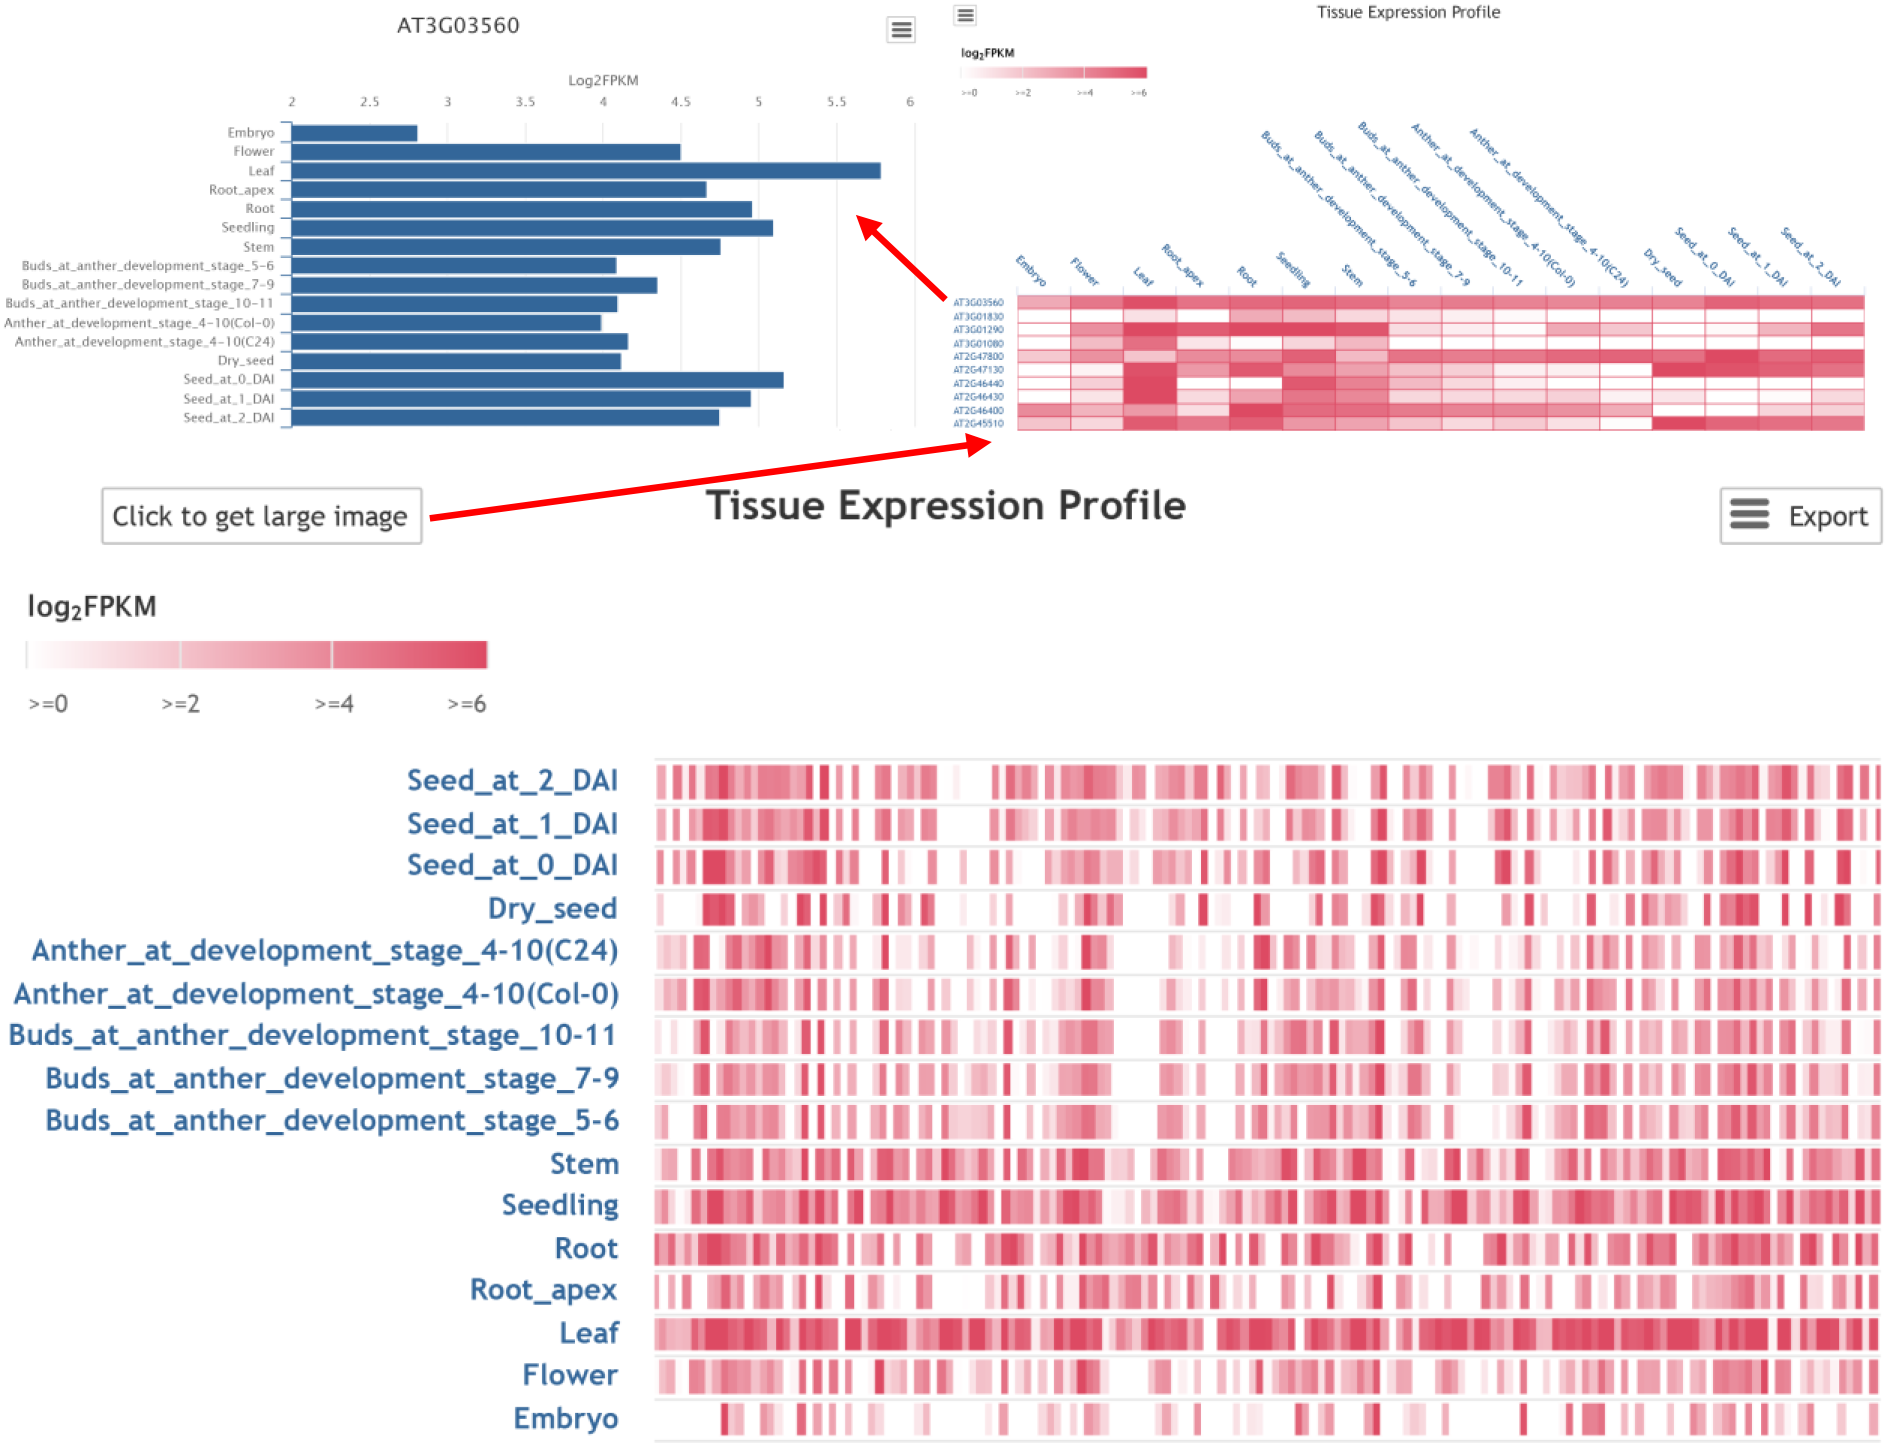
For tissue expression profile, the expression pattern of input gene list across different tissues could be visualized via a heatmap, which could be further zoomed in. Clicking on gene id could get the bar plot representing expression density.
Binding factor enrichment returns the TFs and epigenetic factors whose bindings over-represented surrounding input gene list.
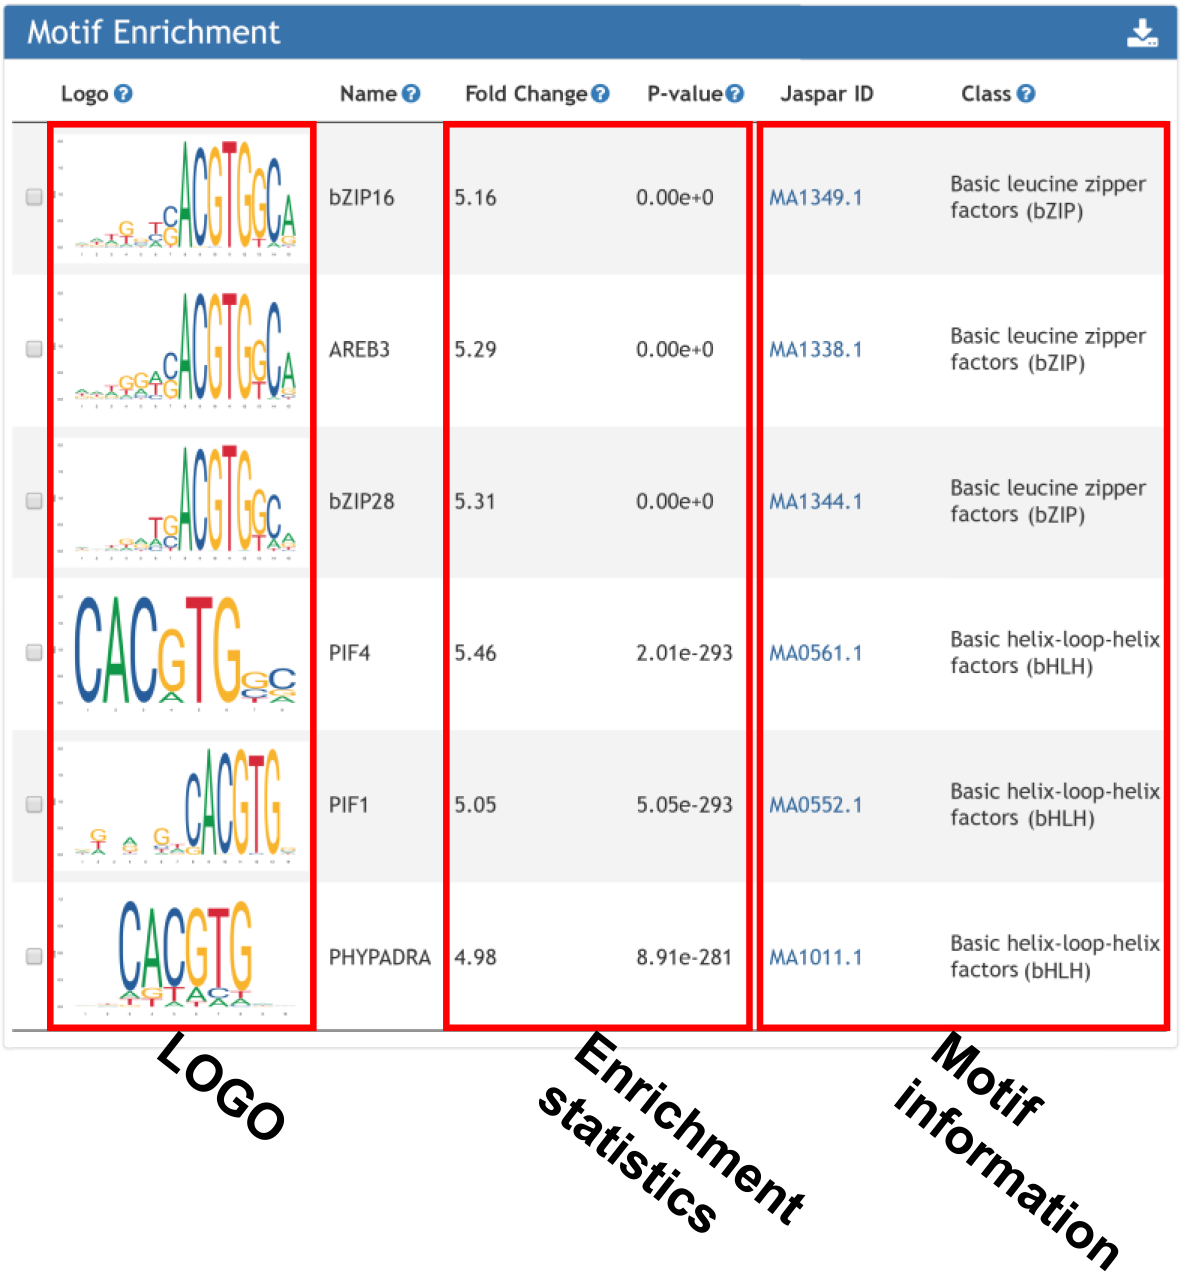
Motif enrichment returns the cis-element over-represented surrounding input gene list.
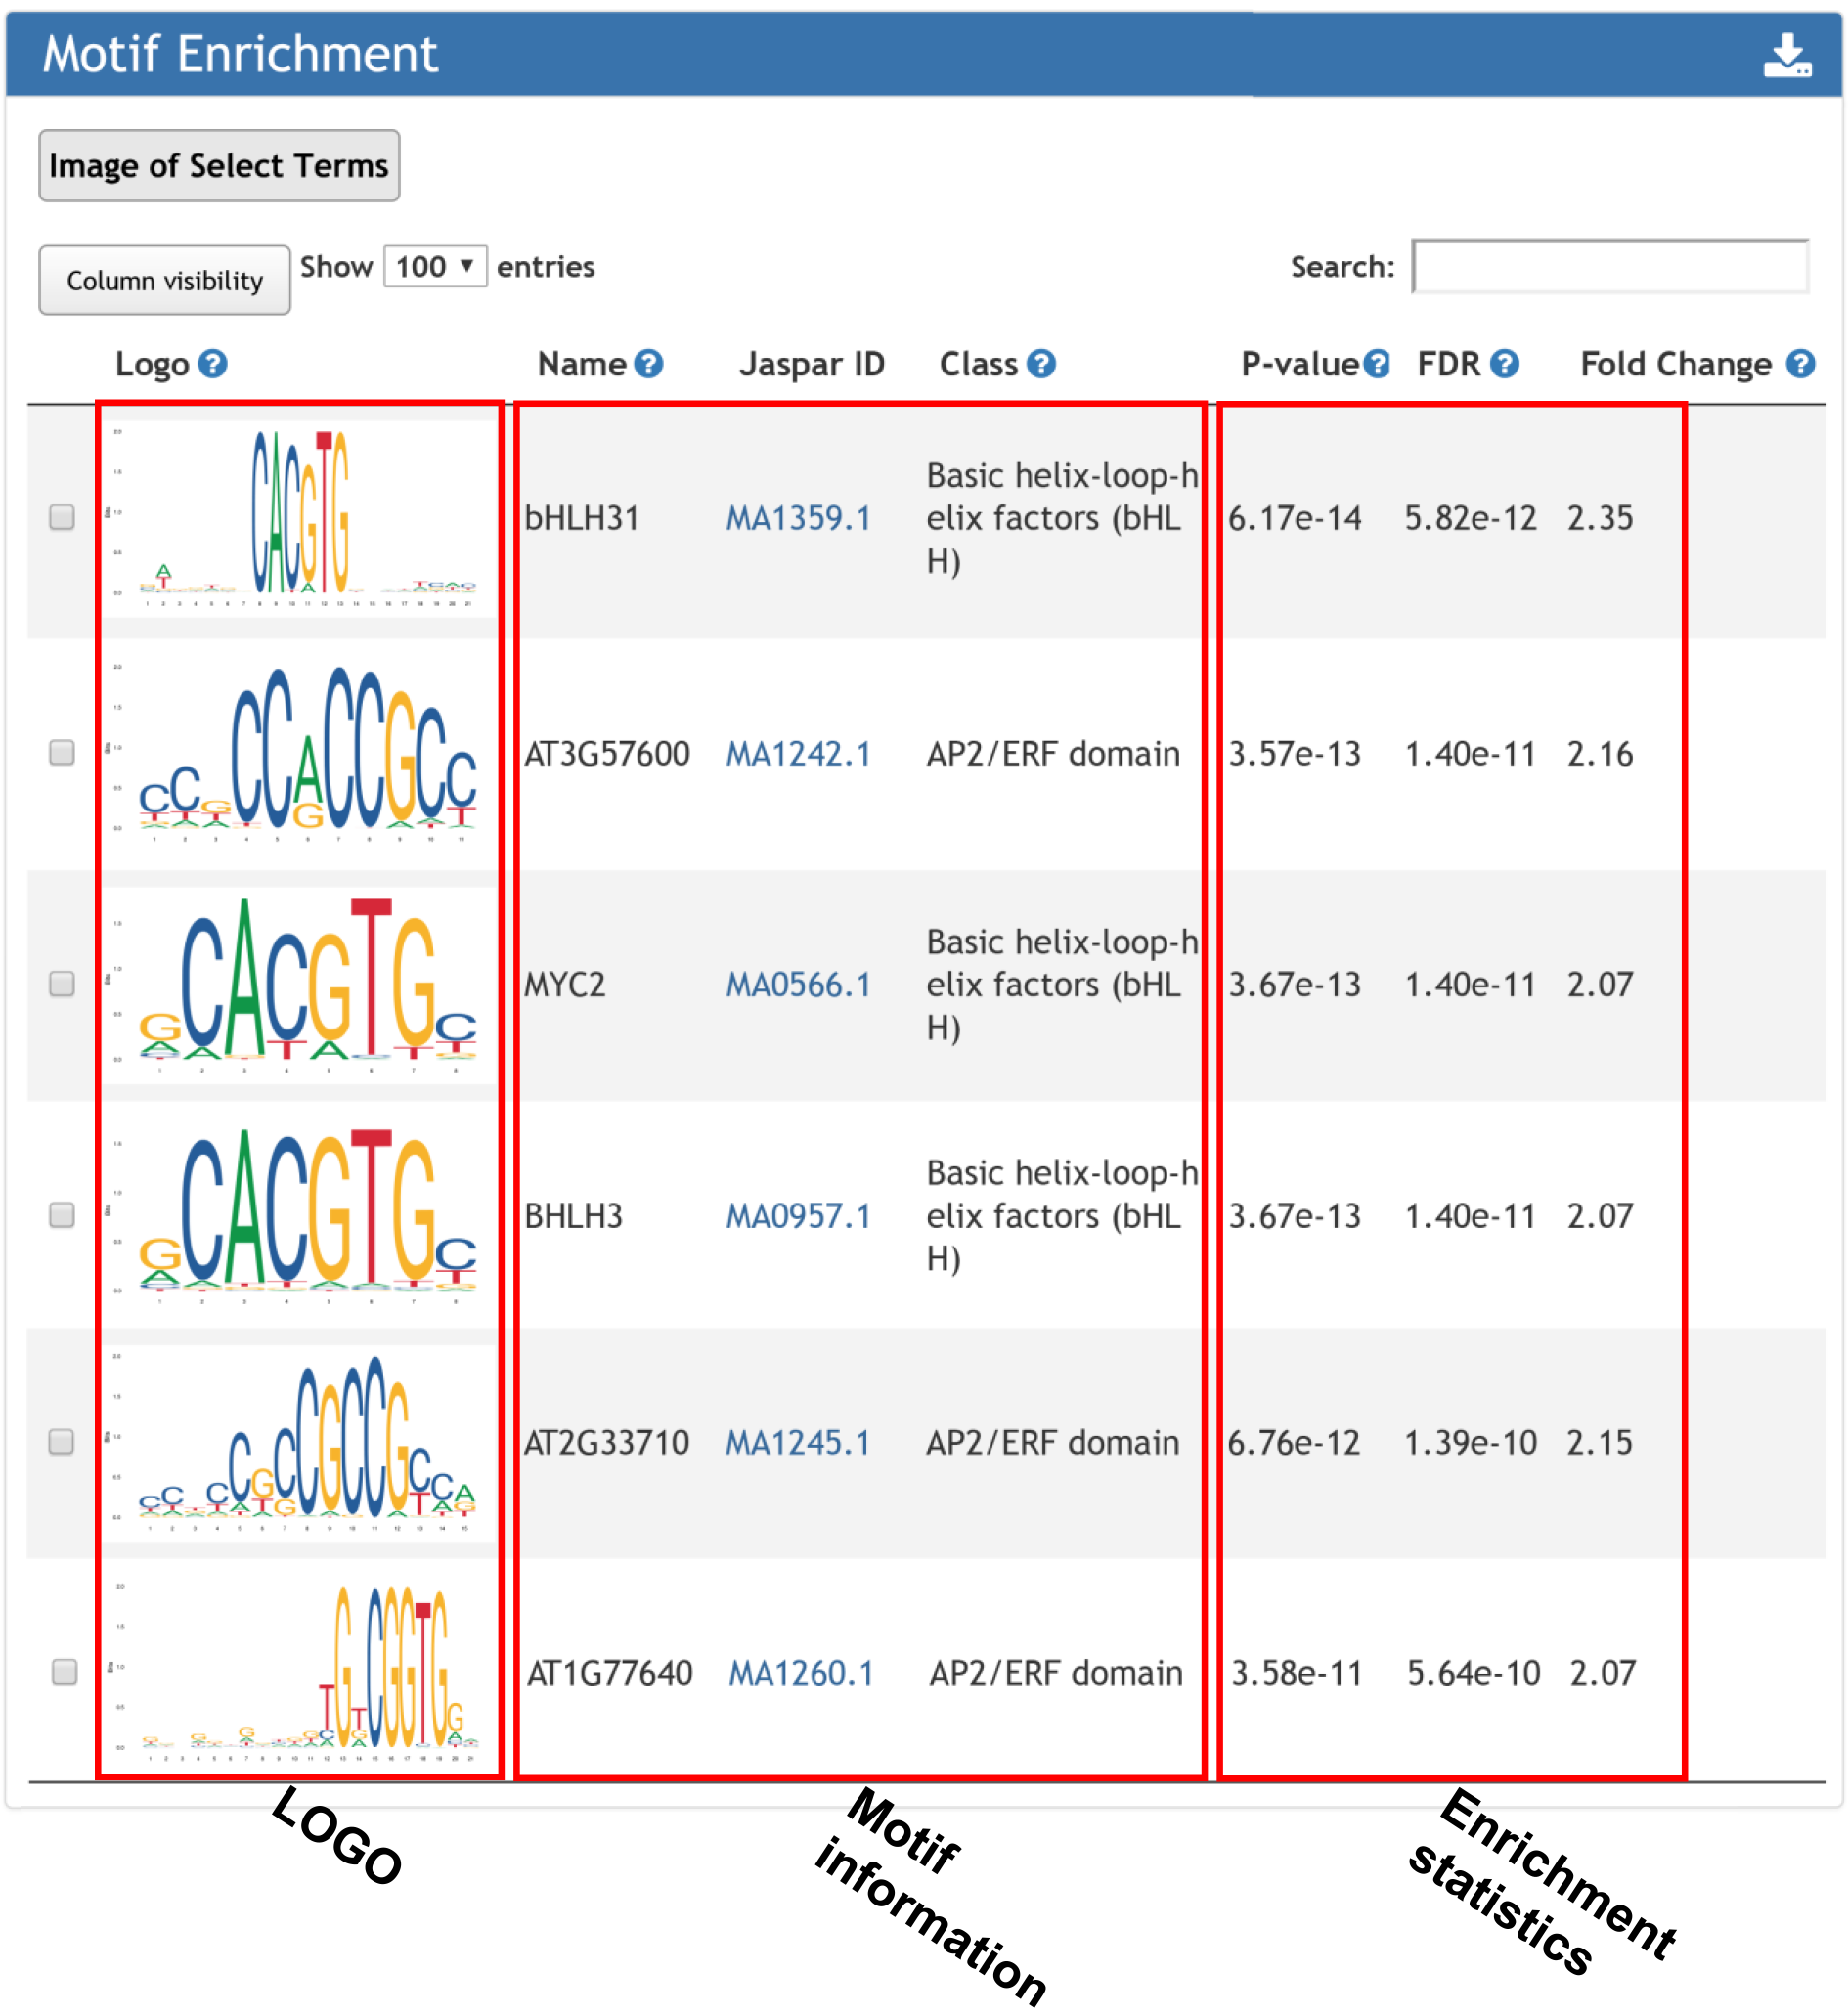
For motif enrichment, motifscan (Sun et al., doi: 10.1038/s41421-018-0045-y) was used to determine whether the occurrence of a given motif in input genes was significantly high as compared to that in random genomic regions. Genomic regions were selected to be 1000bp upstream and downstream of the TSS site.
Interactor enrichment returns the genes interactered with input gene list.
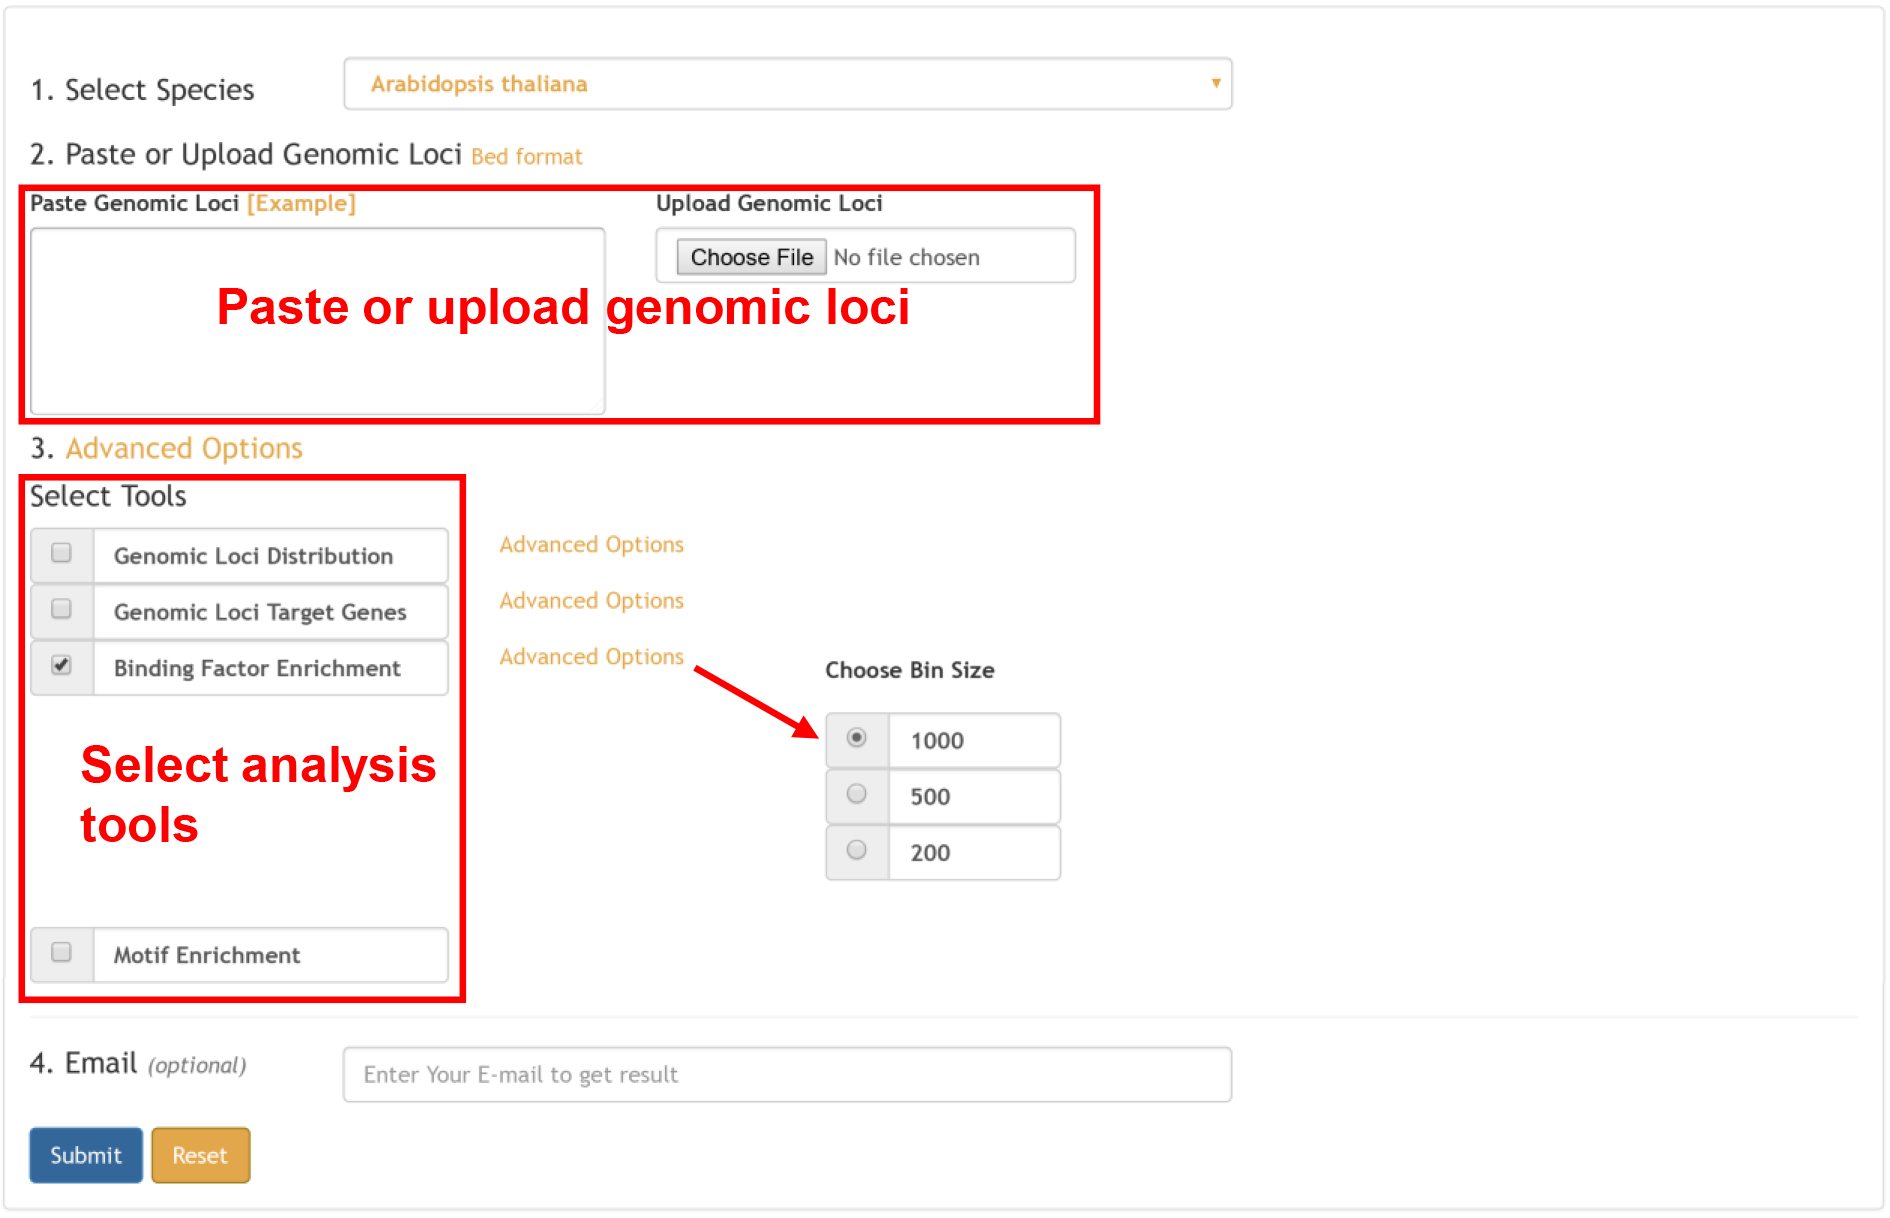
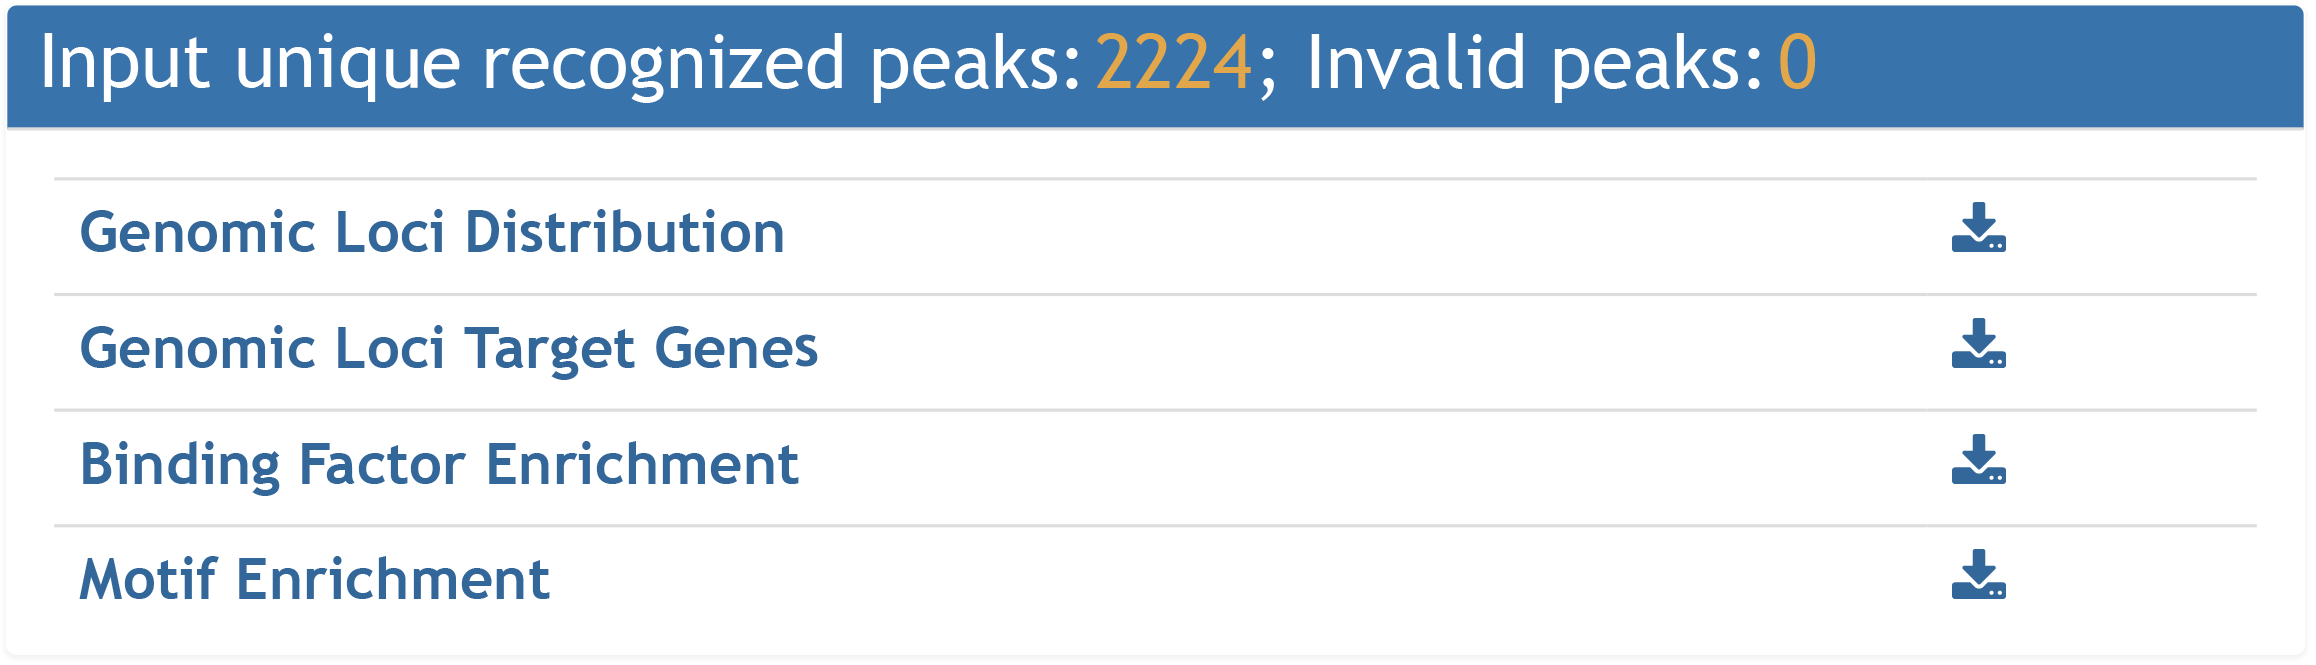
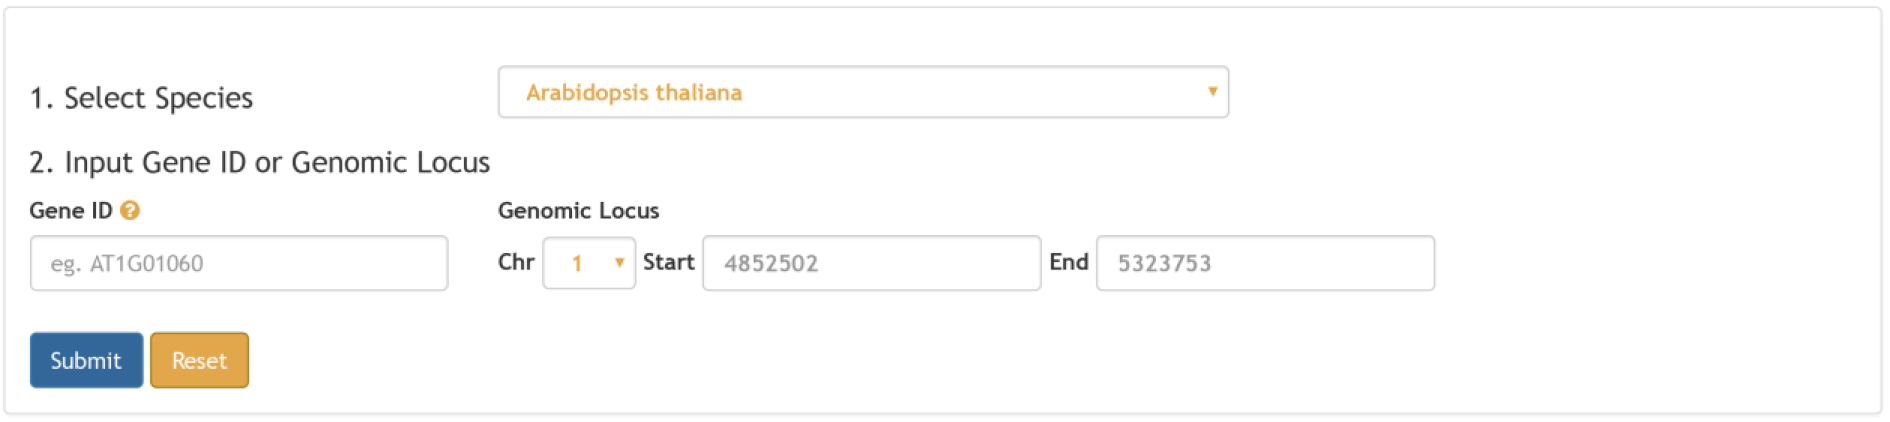
For genomic loci (peak) input, four types of information are provided:
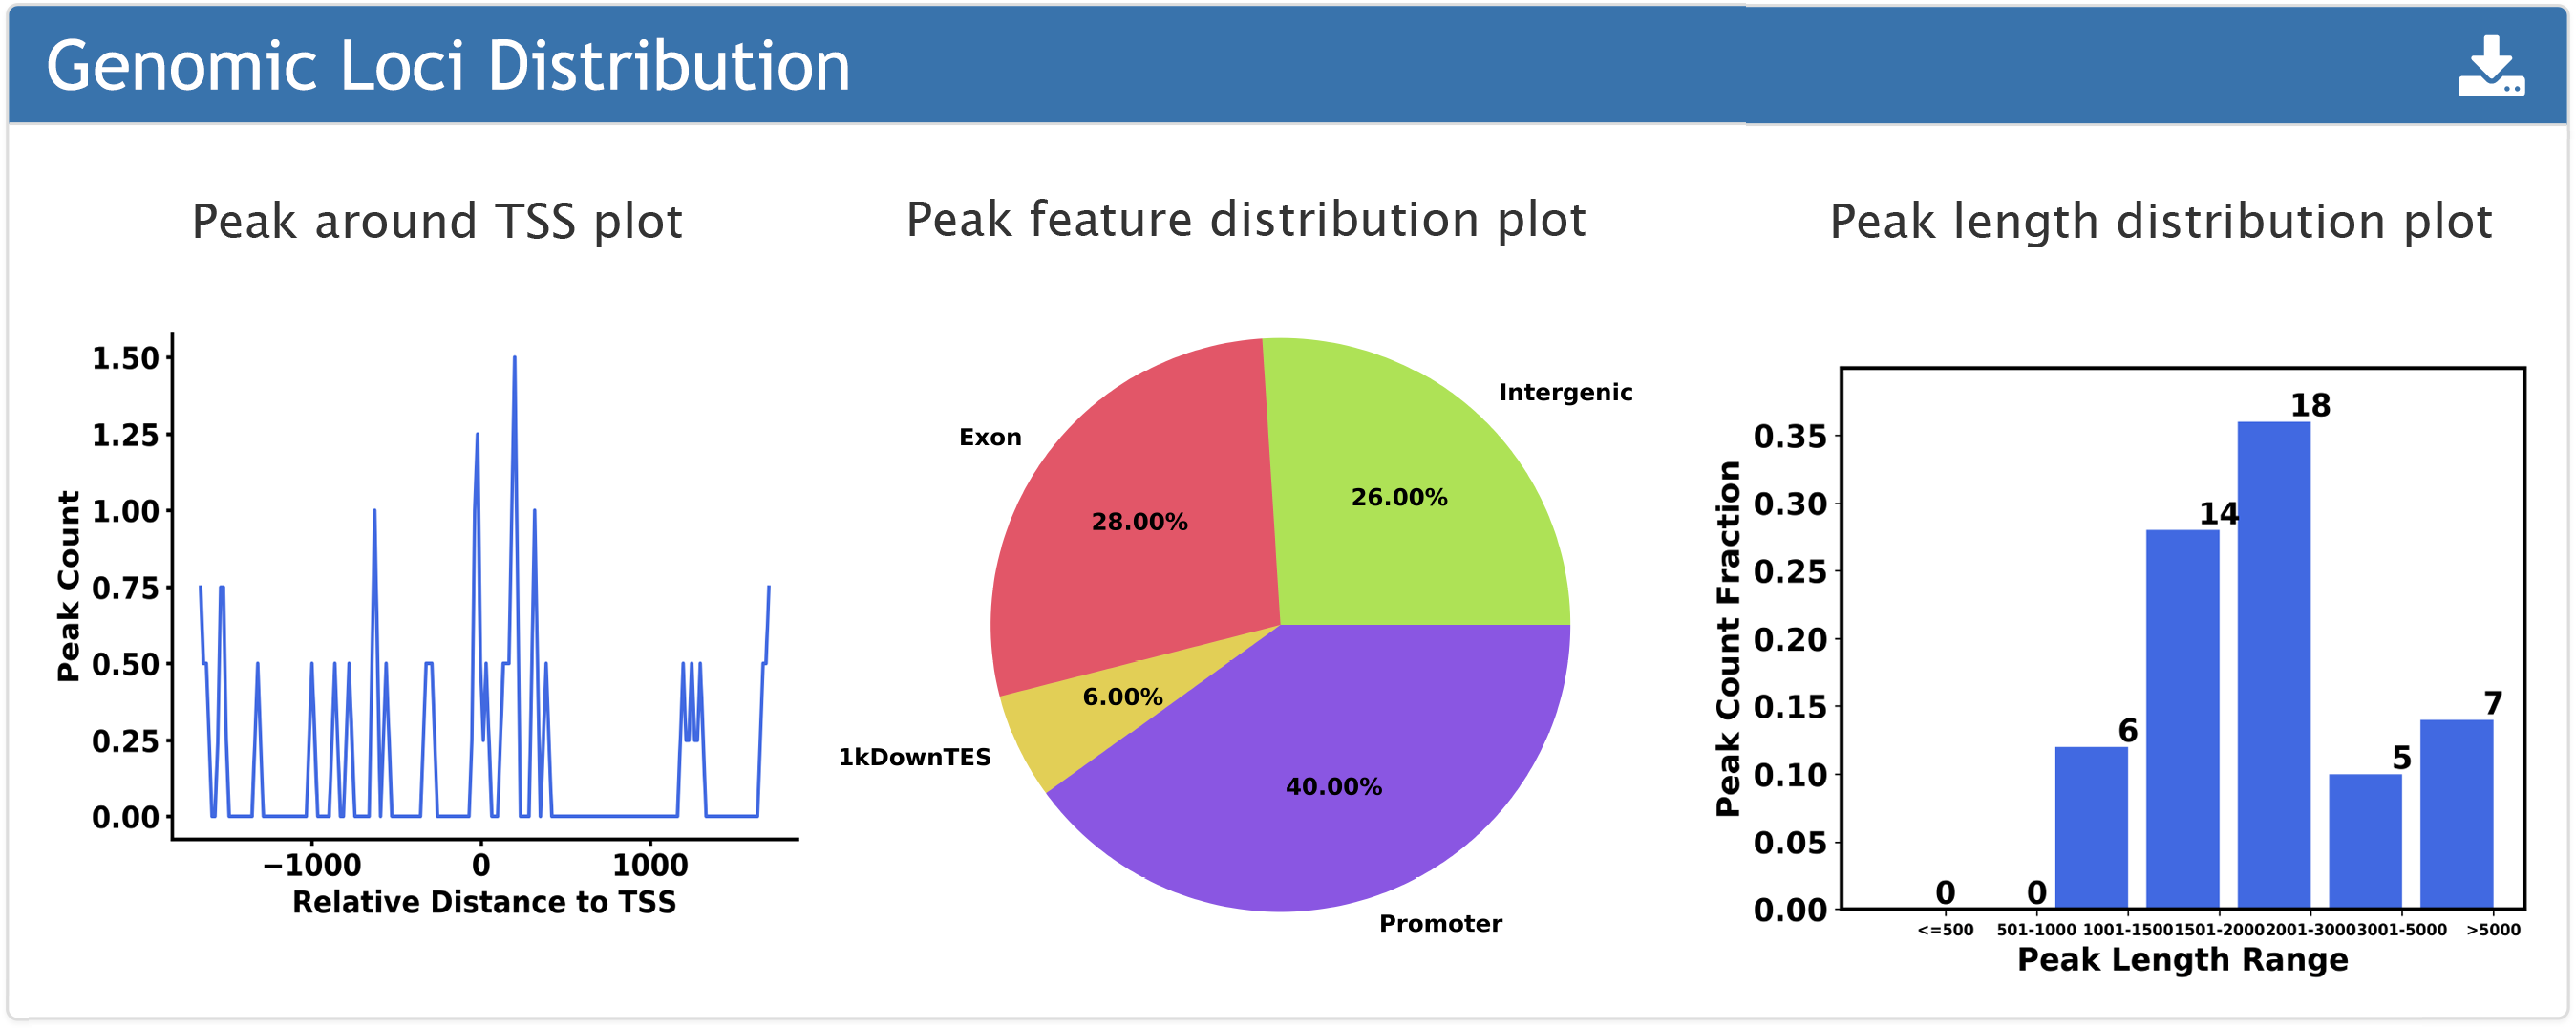
1. The plots of peak distribution.
2. Genomic loci target genes.

3. Factors over-represented surrounding input loci determined by ChIP-seq.
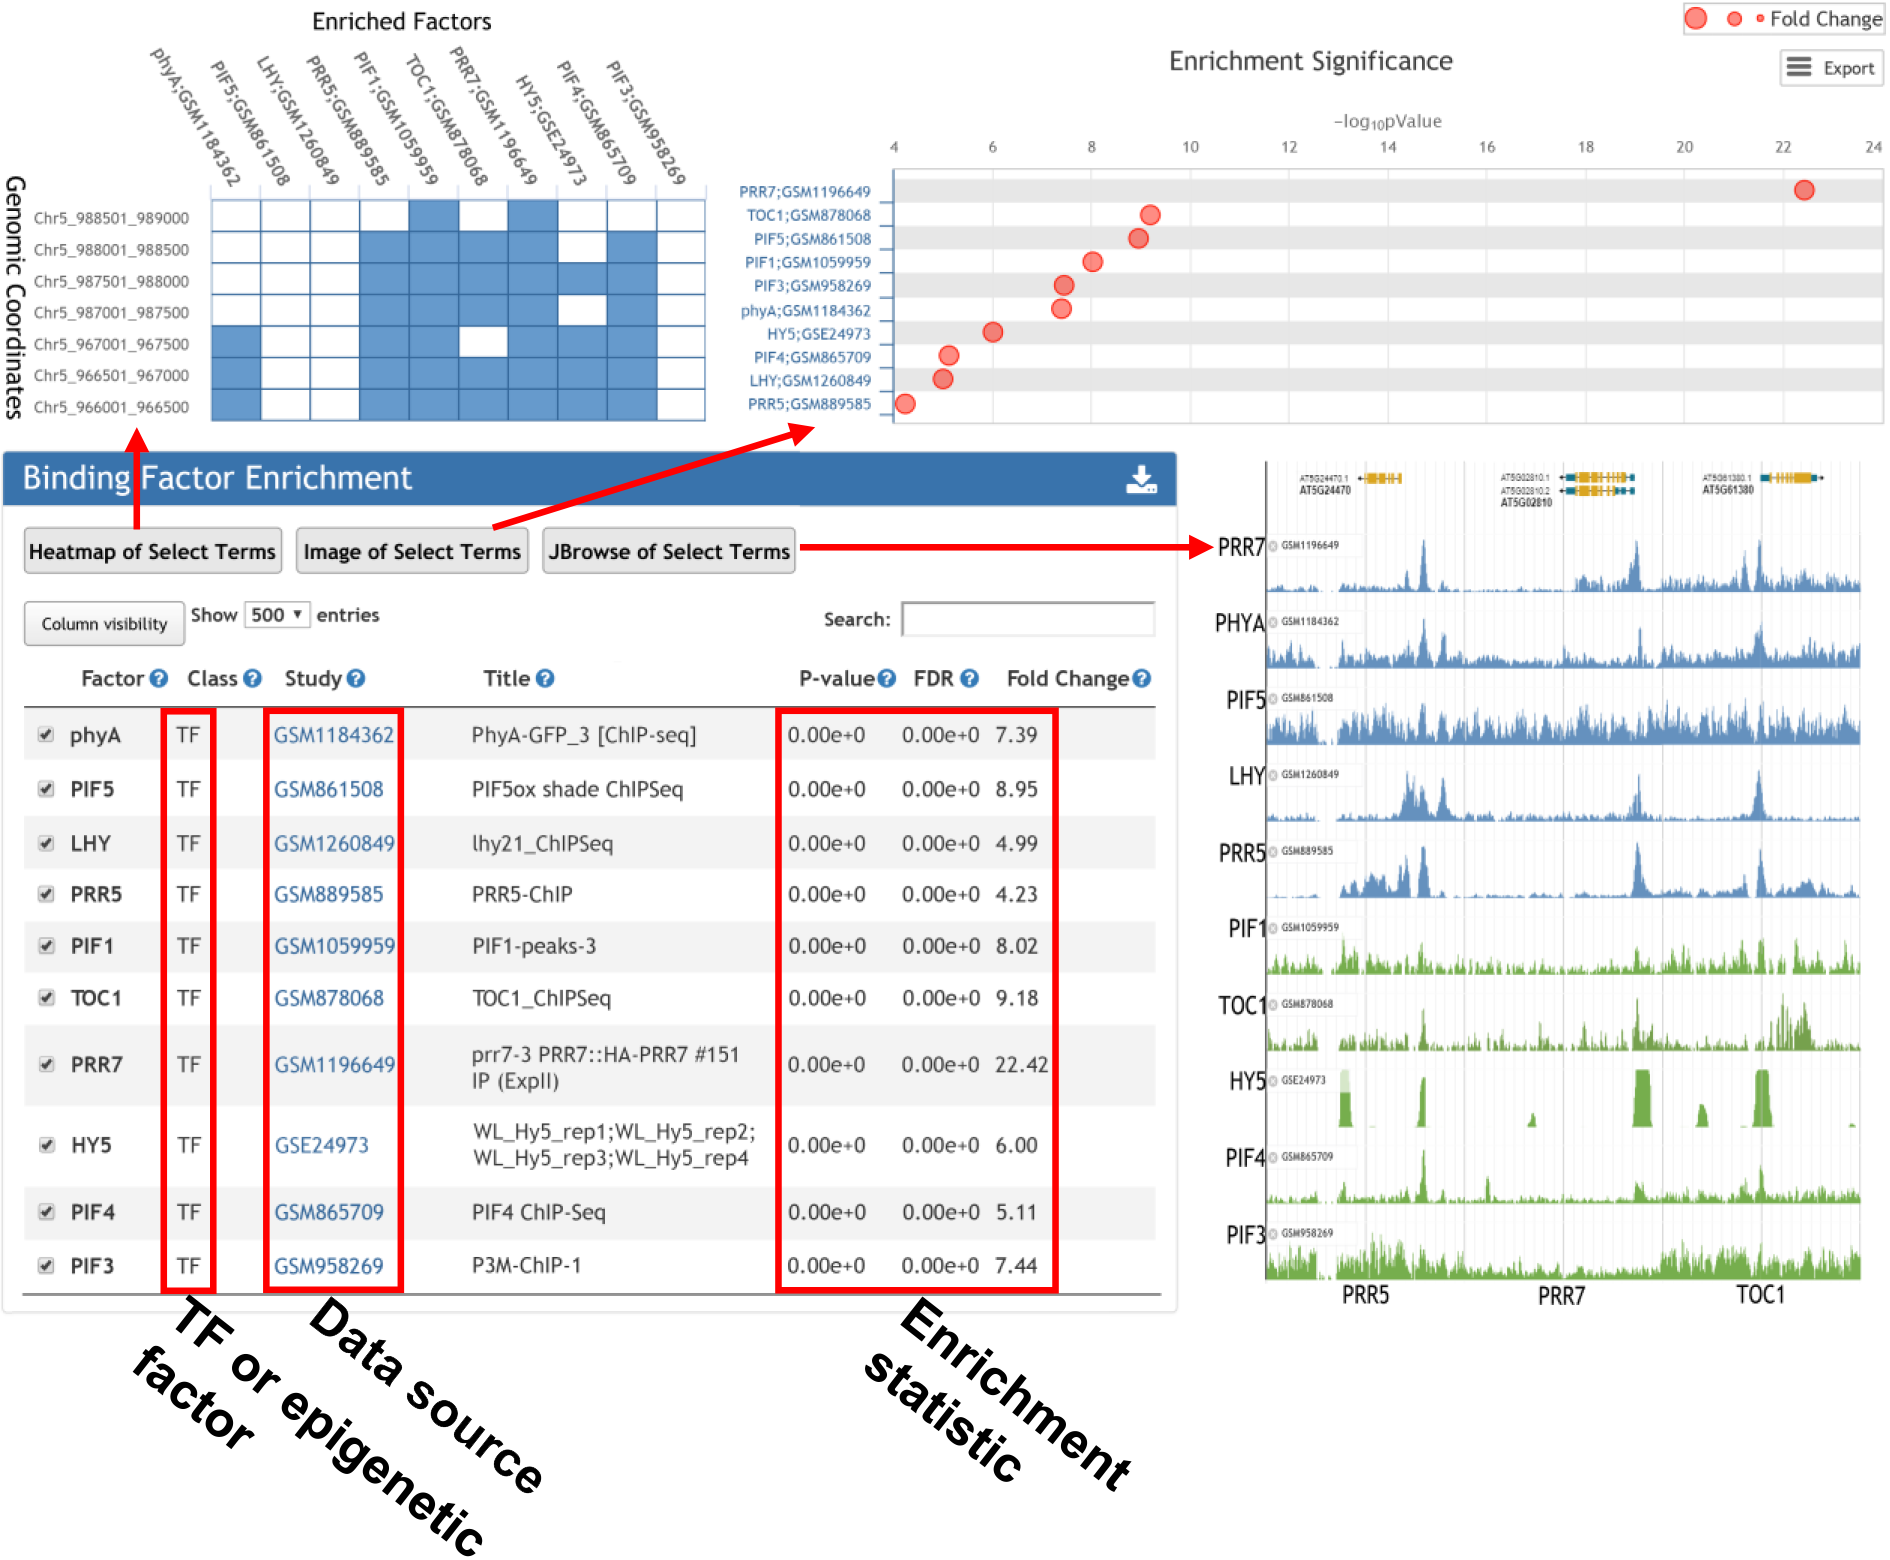
The enrichment analysis was performed as follows. First, the whole genome was divided into 1,000, 500, and 200 bp consecutive bins, selection of which for subsequent analysis is optional, depending on the pattern of input loci. For each peak list processed from the public epigenomic data or input peak list, the positions of overlapped bins were recorded. Next, given that there are some genomic loci detected as a peak region in all ChIP-seq experiments, possibly due to a mis-assembly or a repetitive feature, we generated a blacklist of genomic regions, which were defined as peaks in 124, 5, 38, and 18 negative control ChIP-seq samples in A. thaliana, O. sativa, Z. mays, and G. max, respectively. These regions were removed from further analyses. Finally, Fisher’s exact test was applied to calculate the significance of the overlapped bins between the genomic loci of the input list and in the database, using bins from the whole genome sequence overlapping any peak region as the background. A multiple test correction was completed according to the FDR, Bonferroni correction, and Benjamini and Hochberg methods to lower the false-positive rate.
4. Motifs overrepresented surrounding input loci.
For motif enrichment, motifscan (Sun et al., doi: 10.1038/s41421-018-0045-y) was used to determine whether the occurrence of a given motif in input peak list was significantly high as compared to that in random genomic regions.Genomic regions were selected to be 1000bp upstream and downstream of the TSS site.
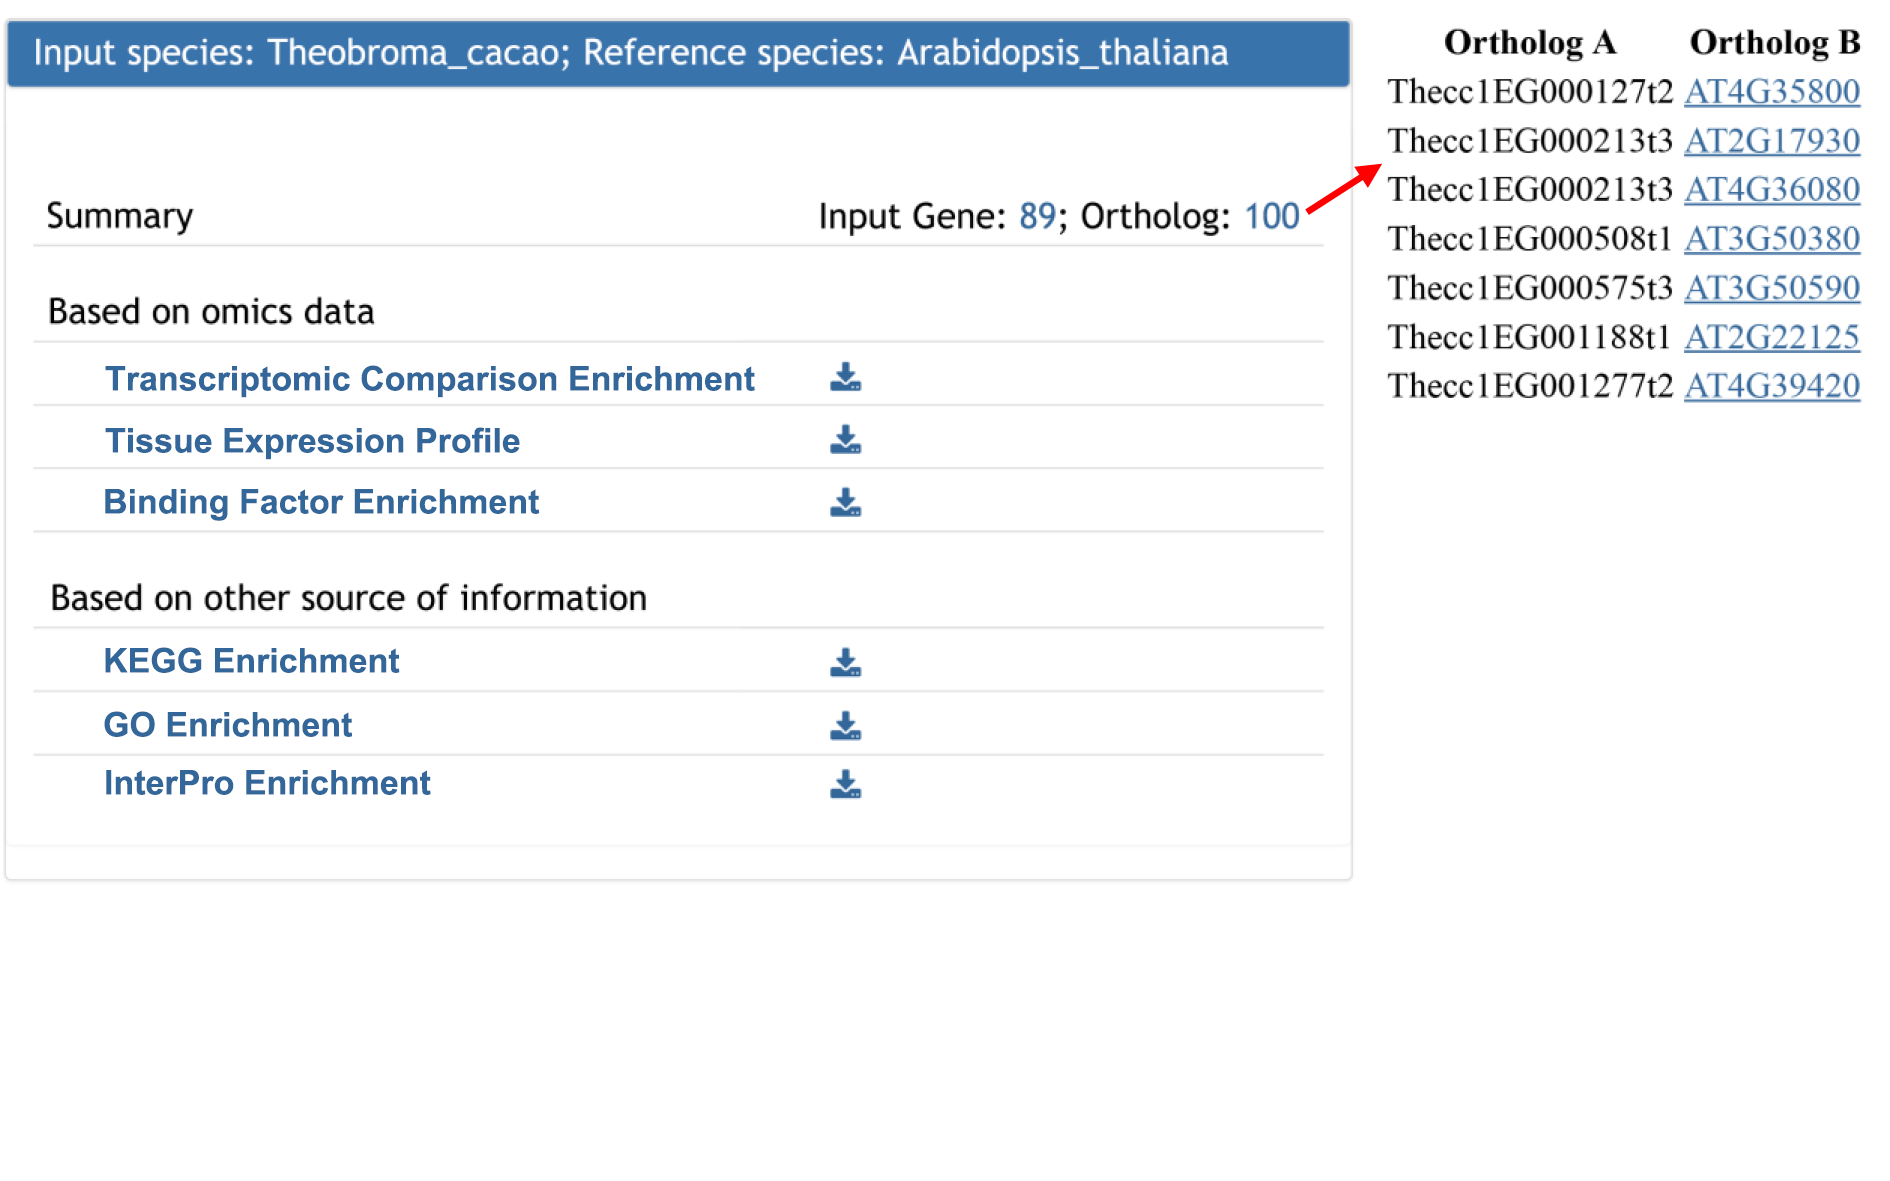
For input from other 56 whole genome sequenced plant species, Plant Regulomics returns the functional and regulatory information of the orthologous genes in 5 reference plant species including Arabidopsis thaliana, Oryza sativa, Zea mays, Glycine max and Solanum lycopersicum. The result is similar to one gene list annotation. Comparison across species provide functional and regulatory information from evolutionary perspective.
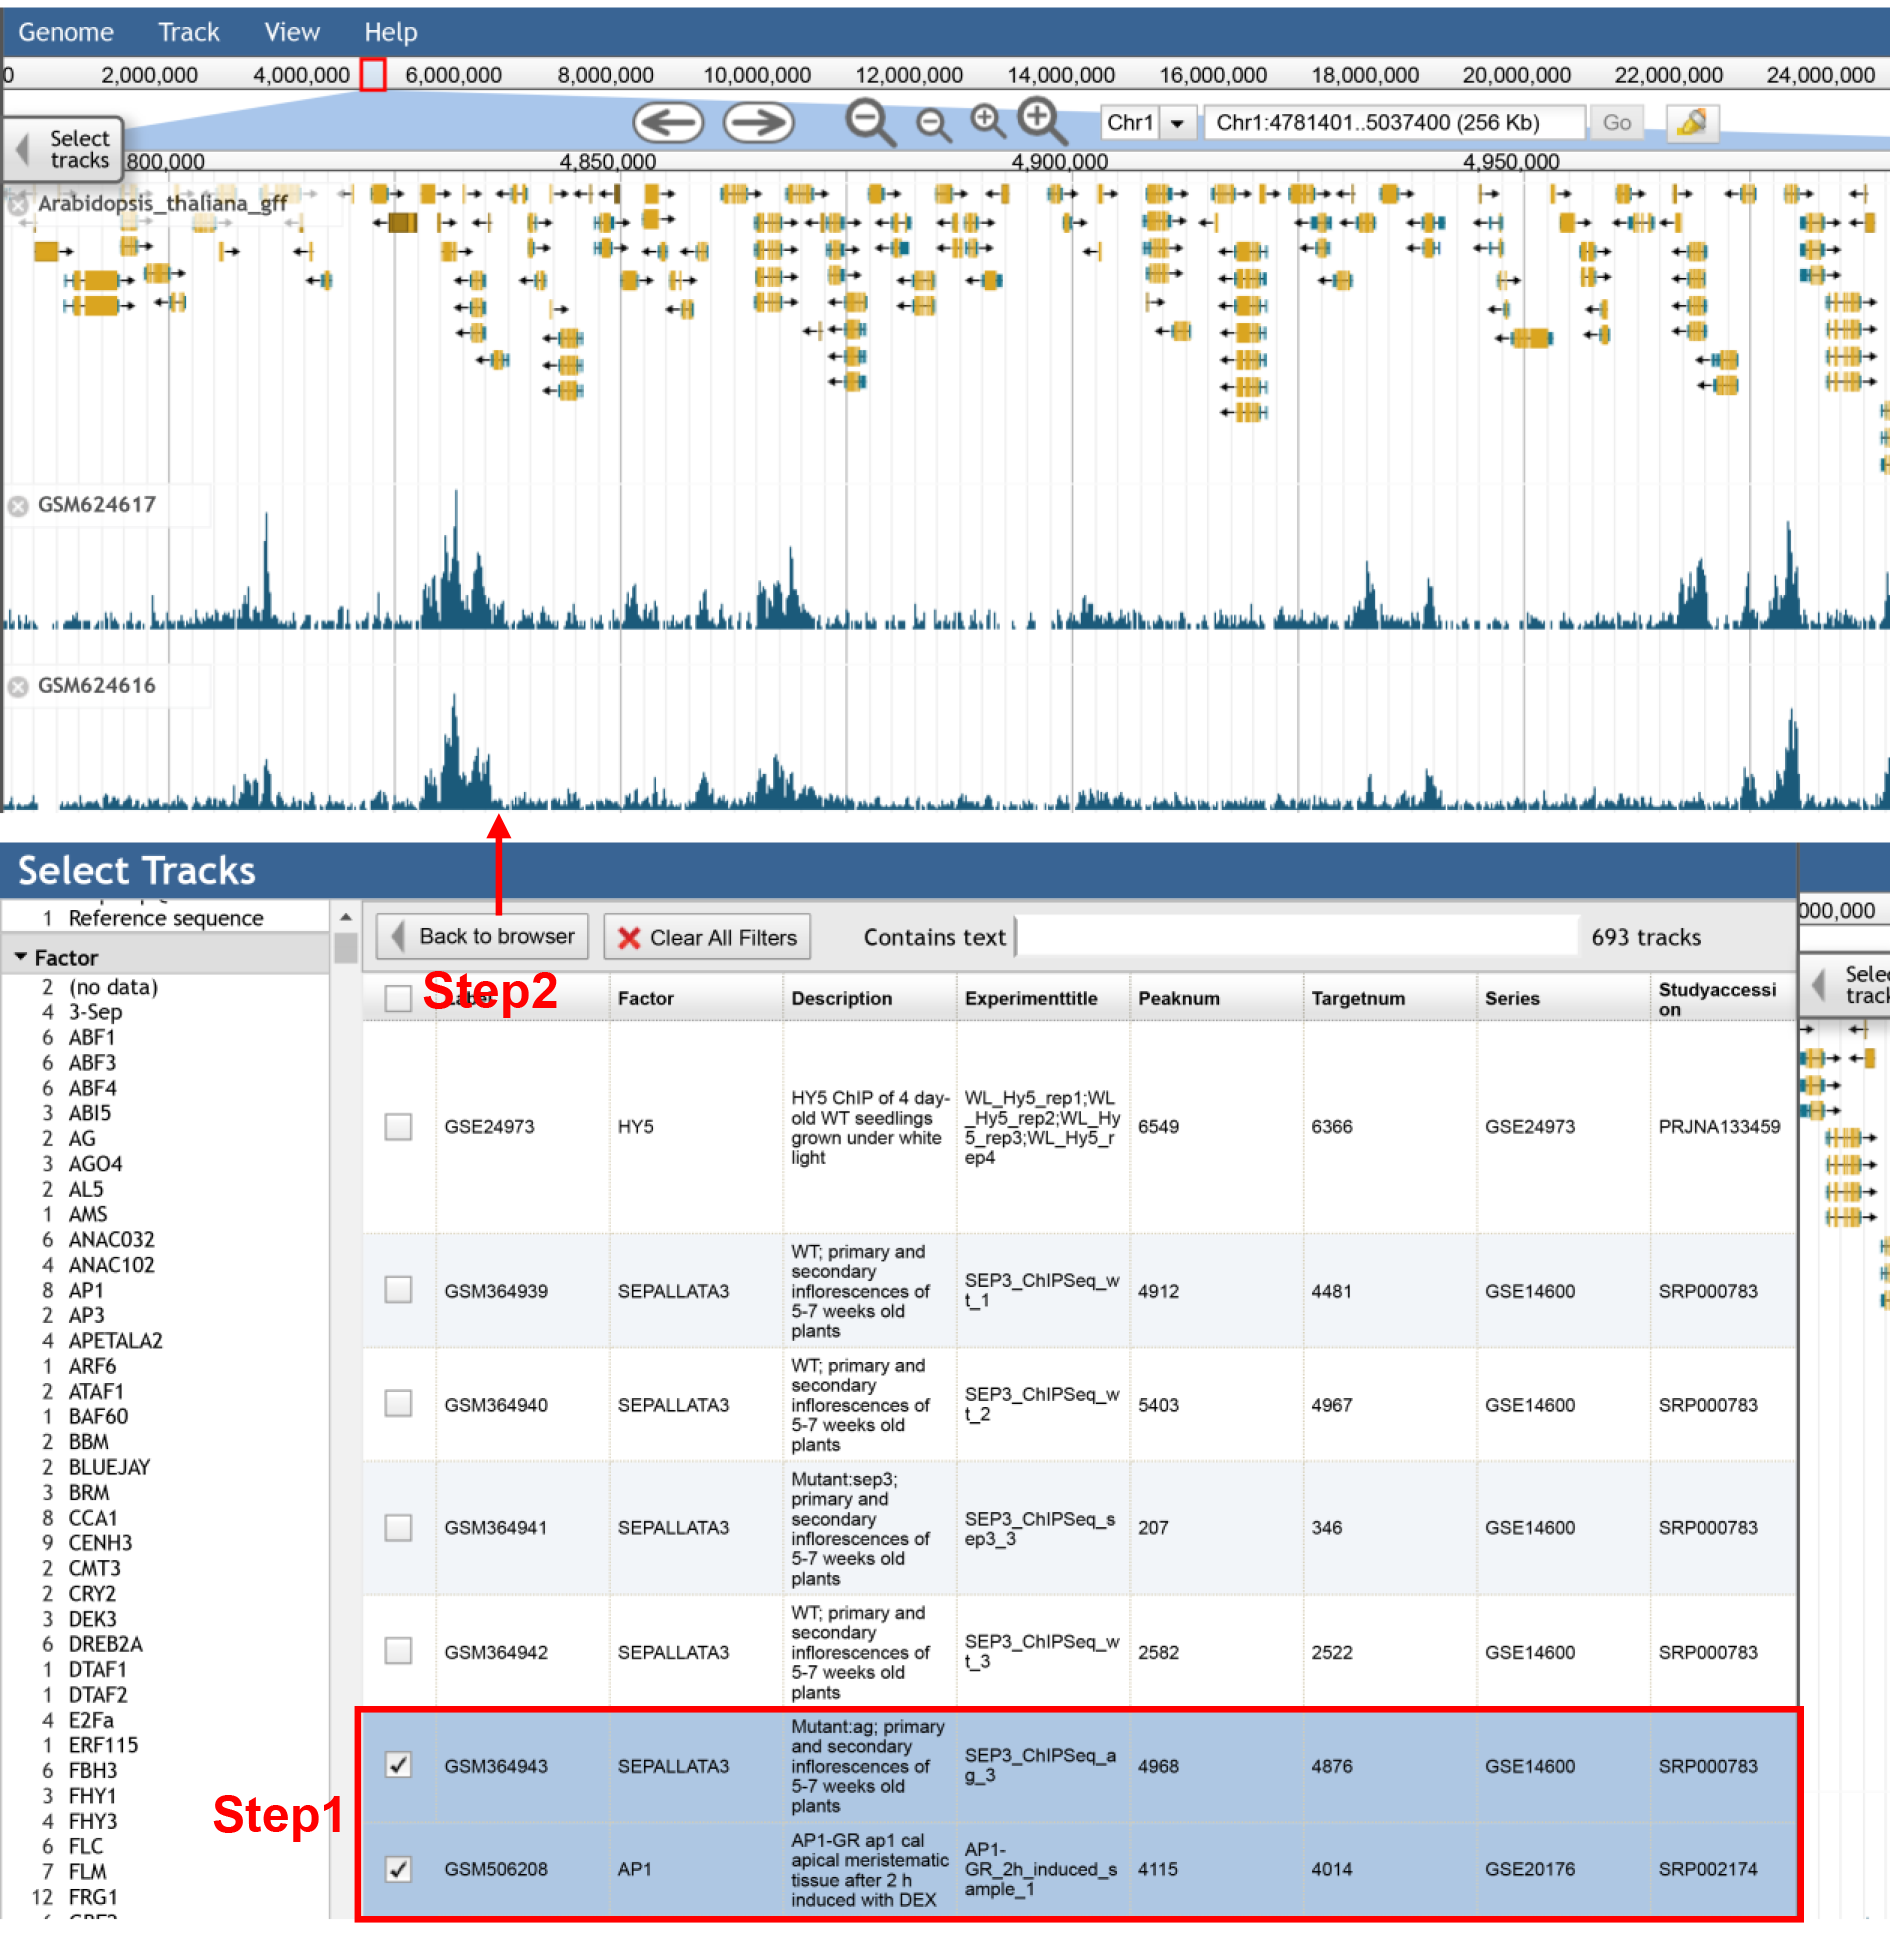
In the selection panel, the detailed information for each sample is provided and could be selected for visualization.

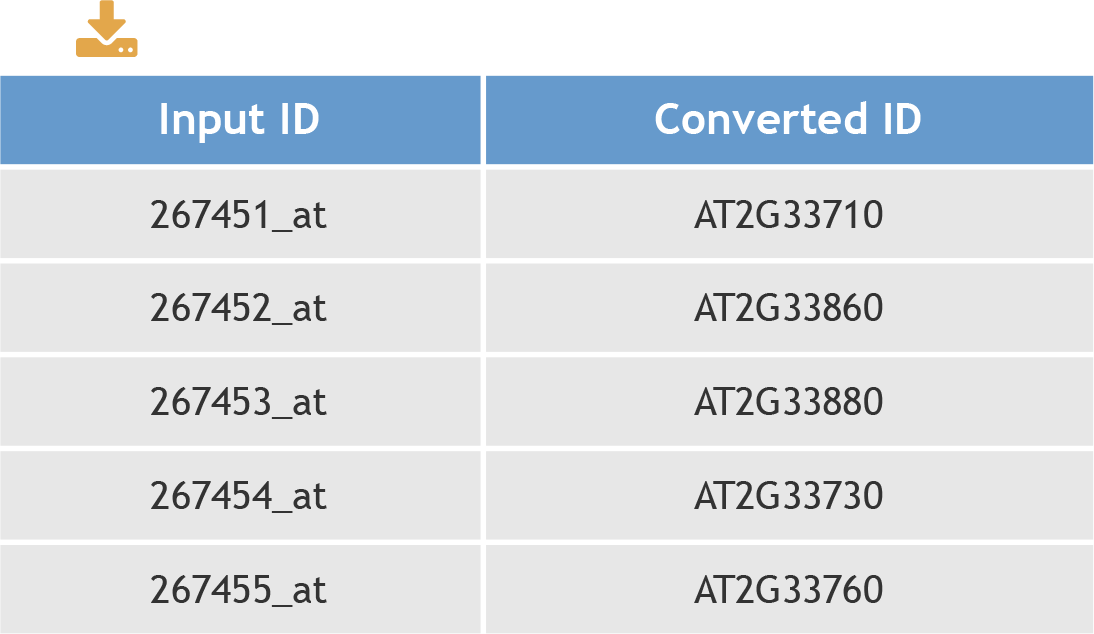
One gene could have different identifiers in different database(s). The ID converter tool could convert users' IDs to the IDs in our database used in each species. The result table contains the input ID(s) and converted ID(s).
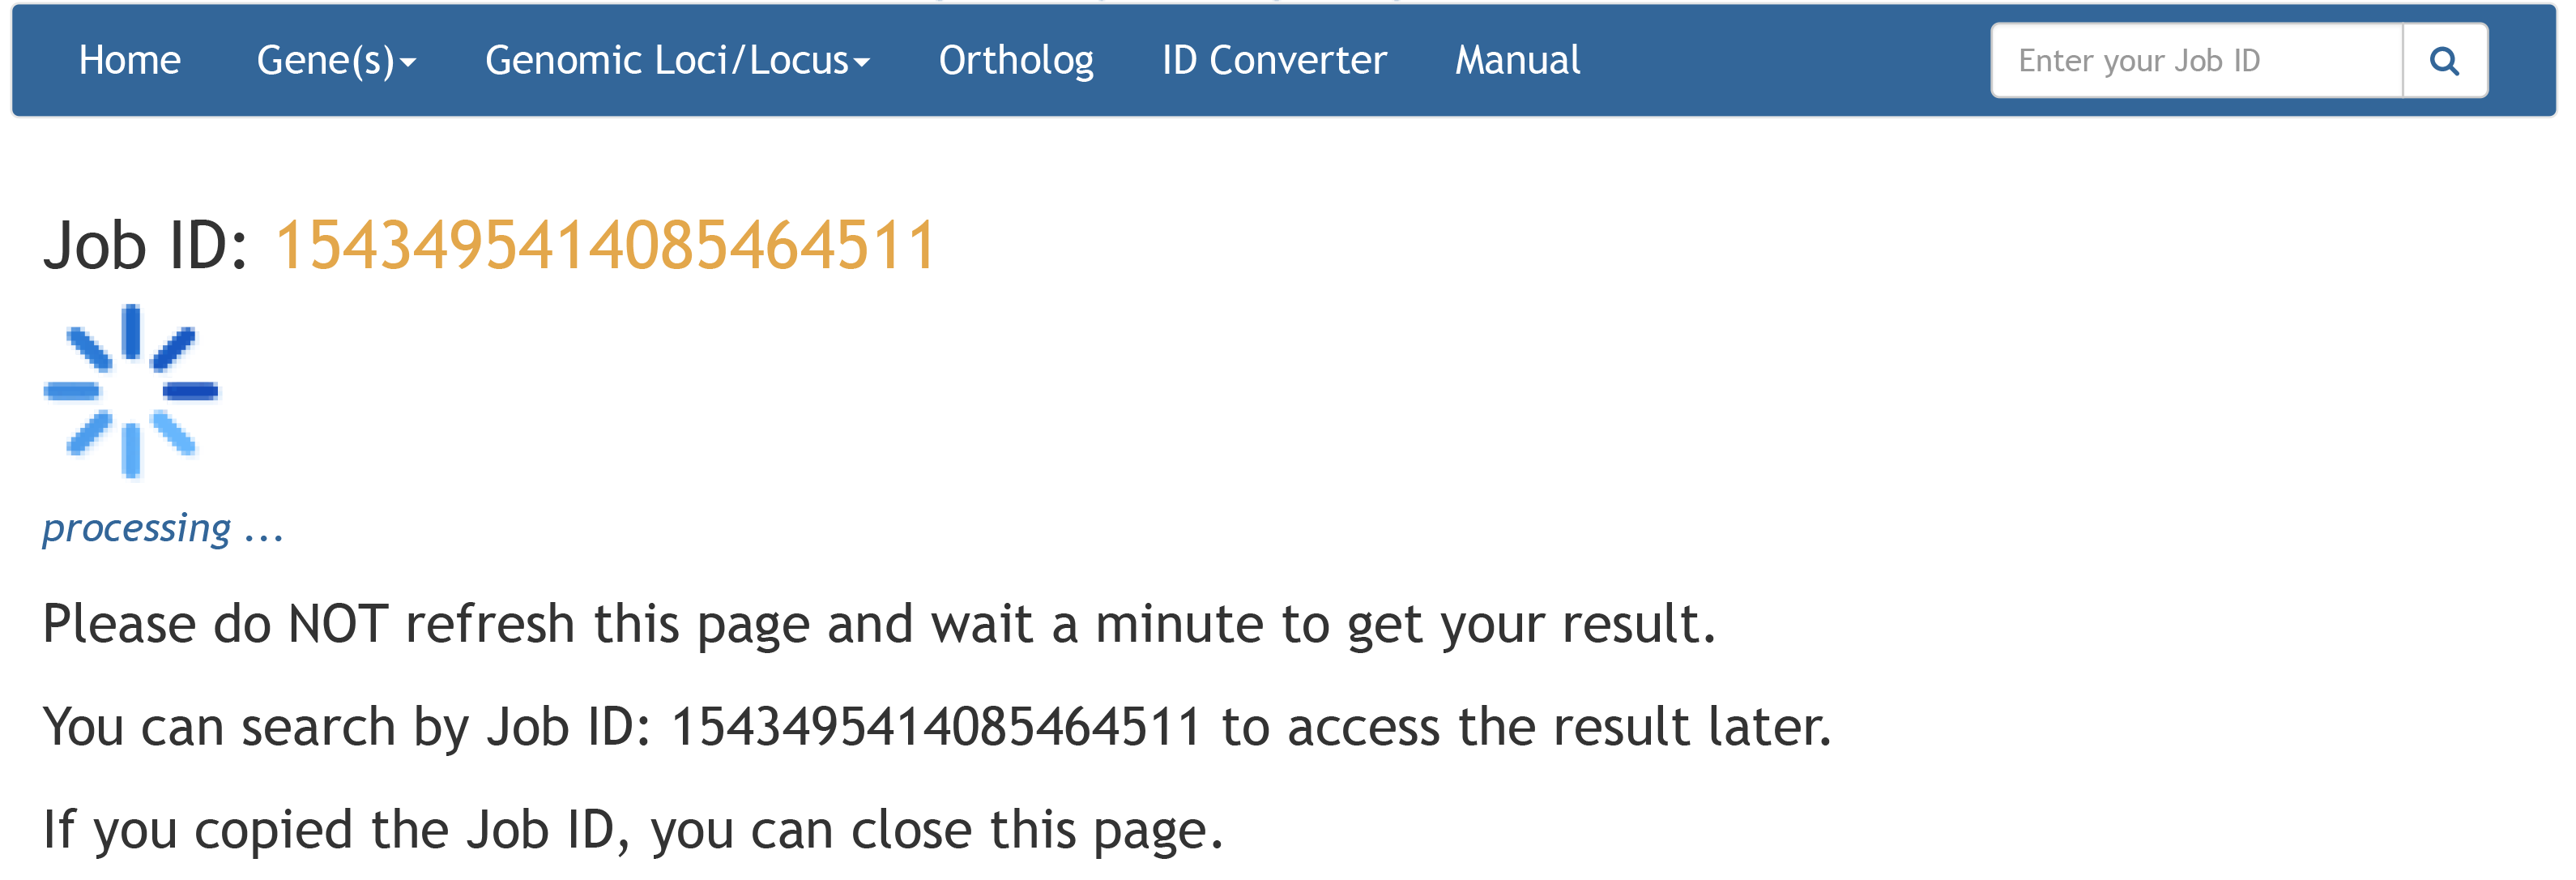
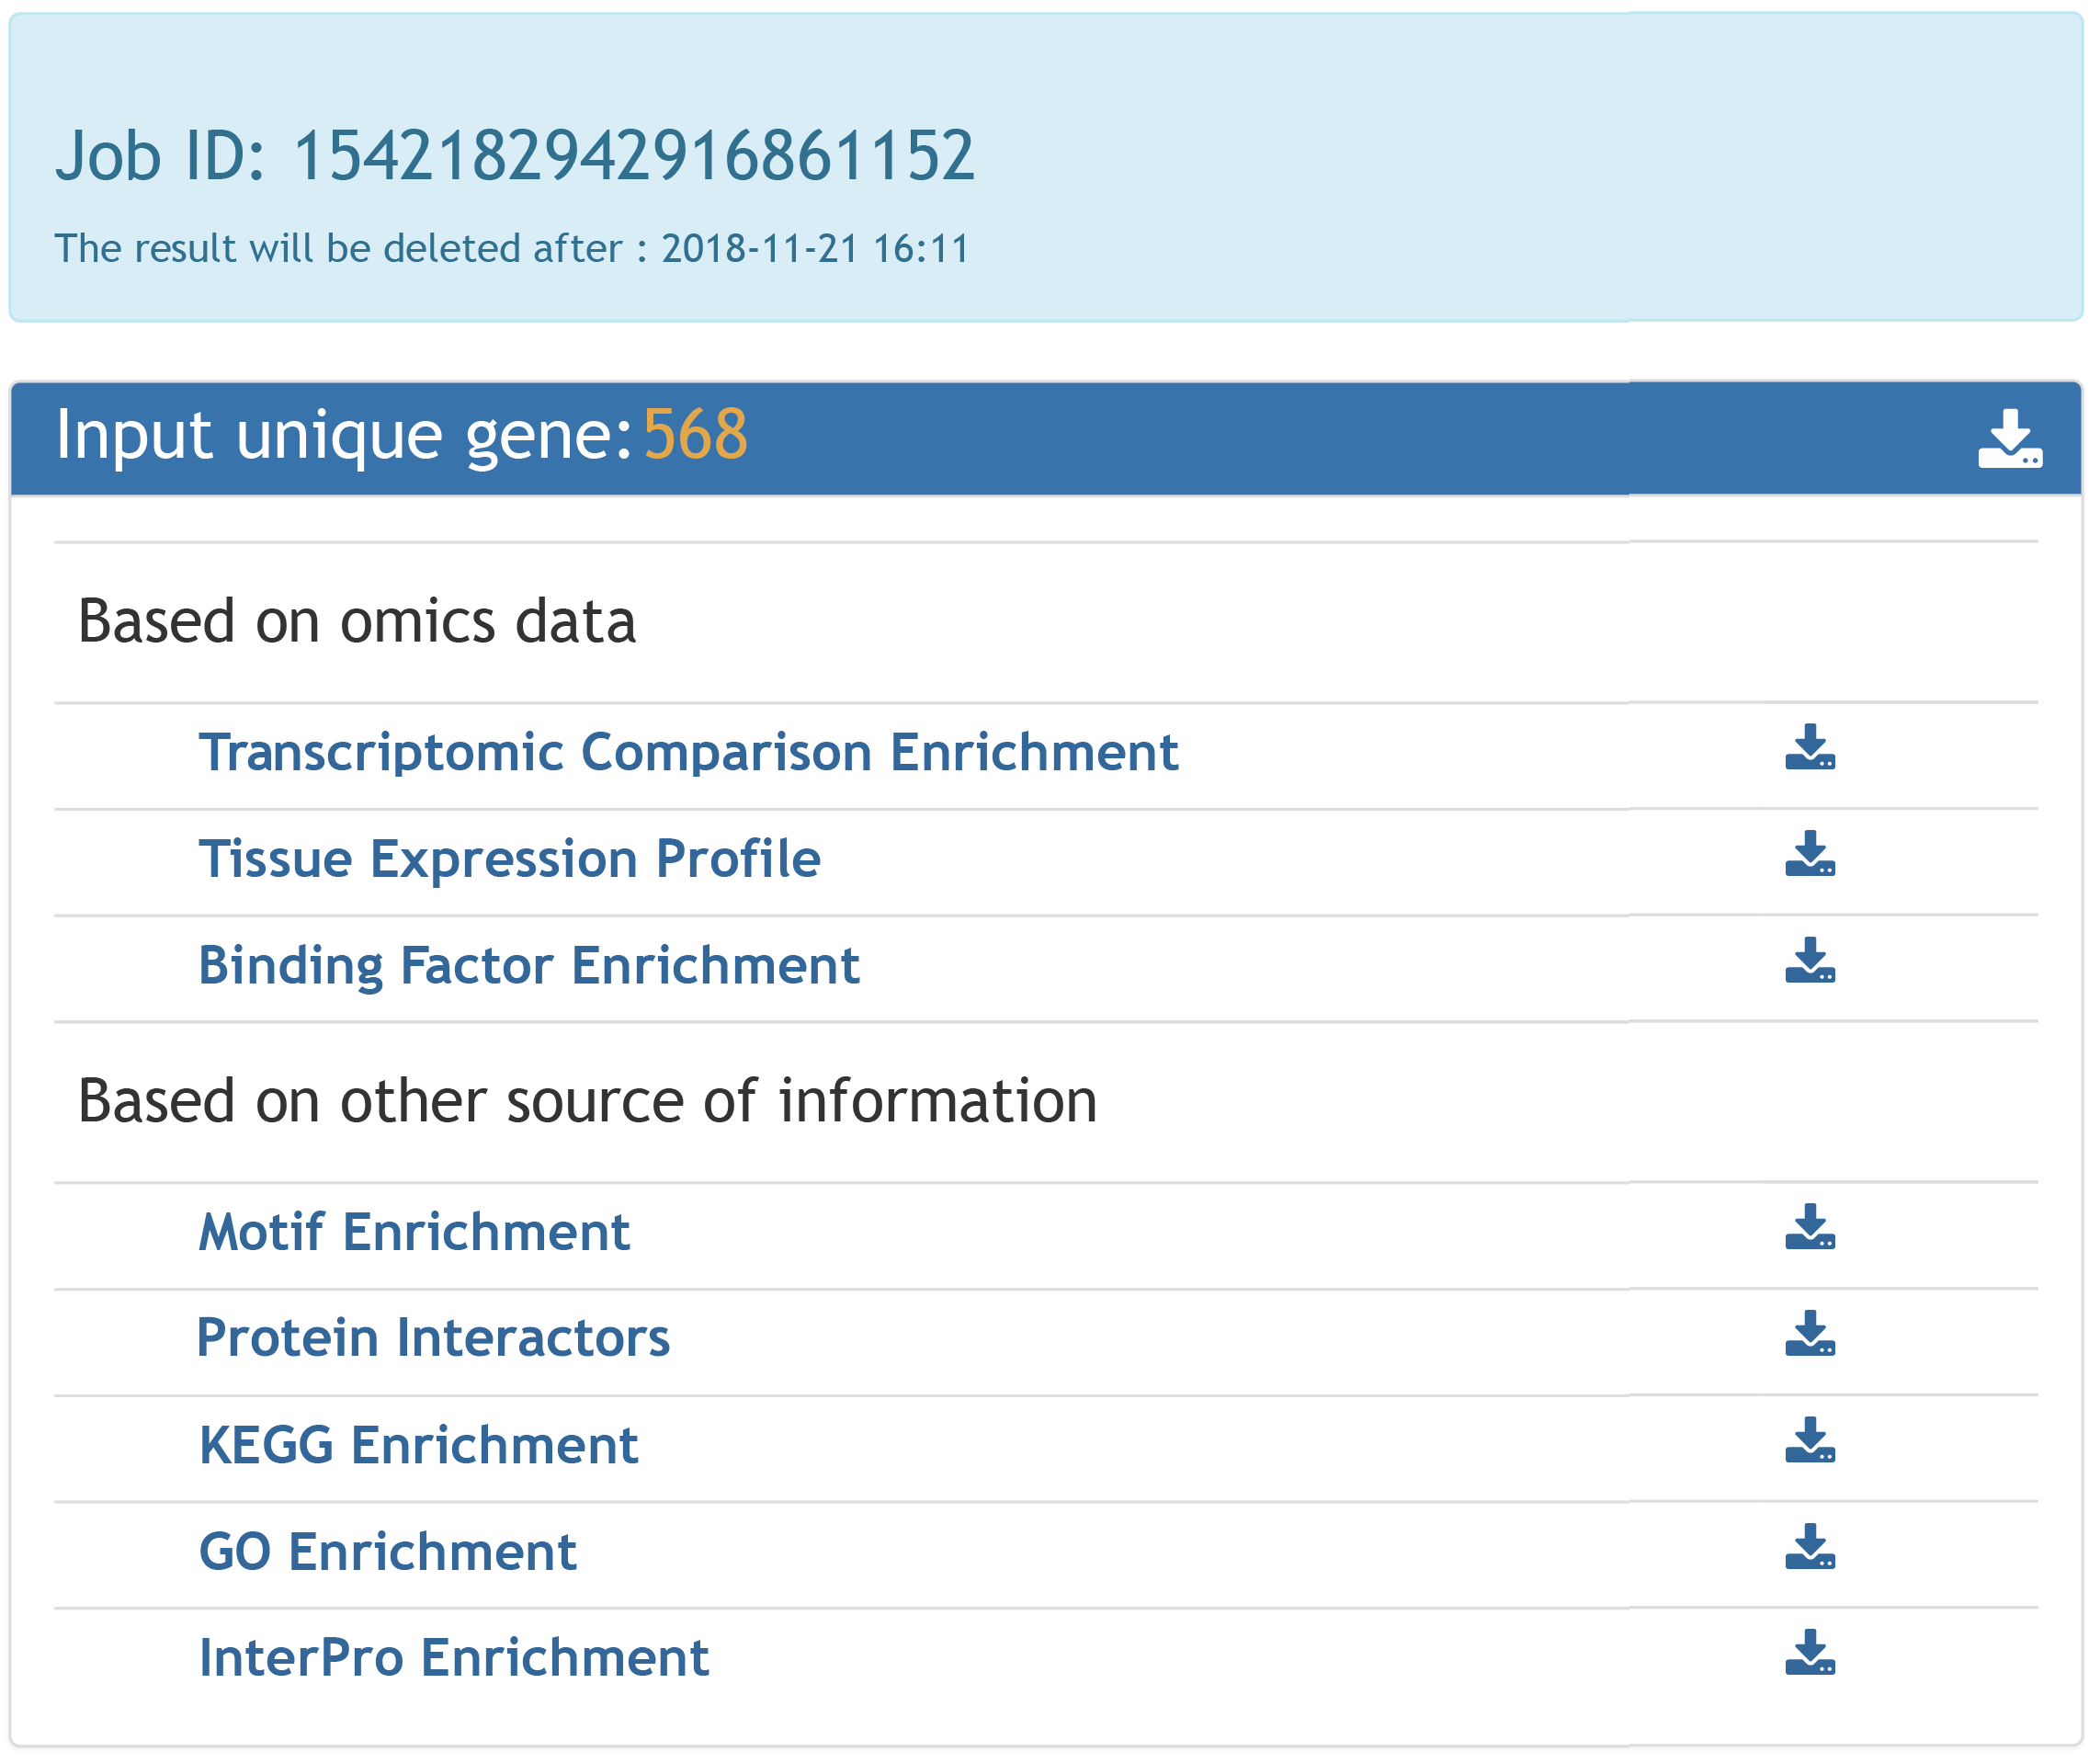
Some analyses may take a long time, if your email address is given, a notification email will be sent your mailbox once the task completed.

Another option to trace your job is using Job ID, which will be generated as the task submitted. You can enter your Job ID in the search box on top of the page to check the status of the job. Once the job is completed, the result page will show up. The job result will be kept in our server for two weeks.