MAnorm2 for quantitatively comparing groups of ChIP/ATAC/DNase-seq samples

Email: shaozhen@picb.ac.cn

Office: Shengli Building 330

Tel. number: 021-54920367

Education and Work Experience:

From 2021.1: Group Leader, CAS Key Lab of Computational Biology, Shanghai Institute of Nutrition and Health, CAS

2013.10 - 2020.12: Group Leader, CAS-MPG Partner Institute for Computational Biology, Shanghai Institute of Nutrition and Health (formed in 2017.1), Shanghai Institutes for Biological Sciences, Chinese Academy of Sciences

2010.6 - 2013.9: Postdoctoral Fellow, Department of Pediatric Oncology, Dana Farber Cancer Institute; Division of Hematology/Oncology, Children’s Hospital Boston; Harvard Medical School;

2009.4 - 2010.5: Postdoctoral Fellow, Department of Biostatistics and Computational Biology, Dana Farber Cancer Institute and Department of Biostatistics, Harvard School of Public Health;

2003.9 - 2008.12: Ph.D. of Theoretical Biophysics, Institute of Theoretical Physics, Chinese Academy of Sciences, China;

1999.9 - 2003.7: Bachelor of Theoretical Physics, University of Science and Technology of China.

MAnorm2 for quantitative comparison of ChIP-seq samples on group level

MAnorm2 is a new computational model for quantitatively comparing two or multiple groups of ChIP/ATAC/DNase-seq samples and detect differential peaks on group level. On one hand, when the samples of each group are biological replicates for the same experiment, differential analysis on the group level can achieve much better specificity and sensitivity than between individual samples. On the other hand, with ChIP-seq profiles for tissues/cells obtained from different individuals, researchers may classify them according to the age, sex, health status, or disease subtype of each donor, and then perform differential analysis between groups of profiles to identify the differential binding events associated with the characteristics.

MAnorm2 incorporates a hierarchical strategy of ChIP-seq data normalization across groups of samples, and performs differential analysis on group level by adaptive modeling of the within-group variation of ChIP-seq signals using an empirical Bayes framework. When the samples in each group are biological replicates, MAnorm2 can reliably detect differential binding events even between closely related cellular contexts.

Go to MAnorm2@github >>>

MAP: model-based analysis of isotope-labeling quantitative proteomic data

MAP is designed to statistically compare quantitative proteomic data generated from two different cell types or states based on isotope-labeling technique, and reliably identify proteins showing significant abundance changes between them (or peptides if the analysis is carried on peptide level). As the key feature of MAP, it can directly model technical errors from the two proteomic profiles under comparison, without borrowing information from parallel technical replicates. It considers all detected proteins as a mixture of differentially and non-differentially expressed ones, and chooses those with low intensity changes to model the contribution of technical and systematic error as a function of the protein intensity level by using a novel step-by-step regression analysis. This estimated error function is then used as the reference to calculate a P-value for each protein to represent the significance of its abundance change.

MAmotif: an integrative toolkit for detecting cell type-specific regulators

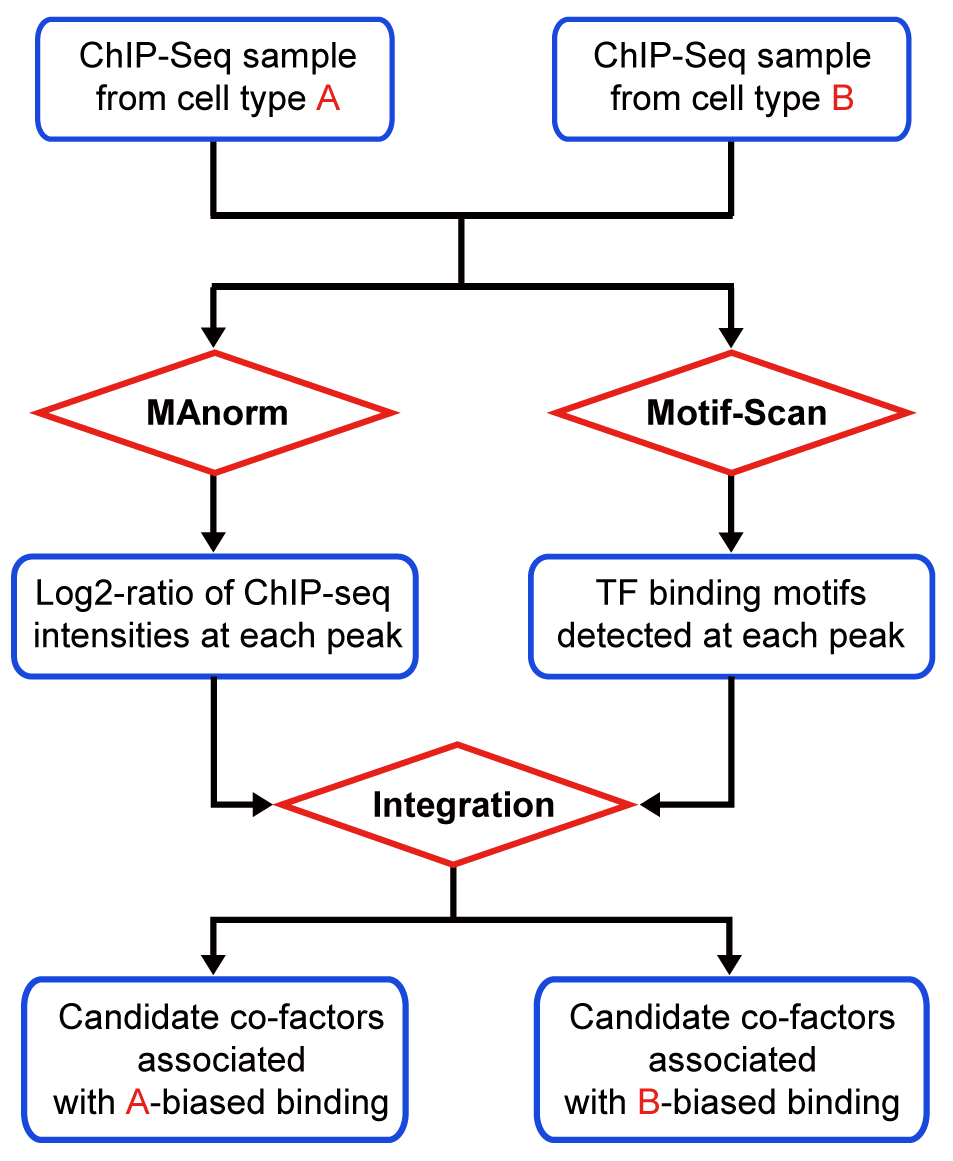
MAmotif is used to compare two ChIP-seq samples of the same protein from different cell types (or conditions, e.g. wild-type vs mutant) and identify transcriptional factors (TFs) associated with the cell type-biased binding of this protein as its co-factors, by using TF binding information obtained from motif analysis (or from other ChIP-seq data). MAmotif automatically combines MAnorm model to perform quantitative comparison on input ChIP-seq samples together with Motif-Scan toolkit to scan ChIP-seq peaks for TF binding motifs, and uses a systematic integrative analysis to search for TFs whose binding sites are significantly associated with the cell type-biased peaks between two ChIP-seq samples. When applying to ChIP-seq data of histone marks of regulatory elements (such as H3K4me3 for active promoters and H3K9/27ac for active promoters and enhancers), or DNase/ATAC-seq data, MAmotif can be used to detect cell type-specific regulators .

Motif-Scan: scan input genomic regions with known DNA motifs

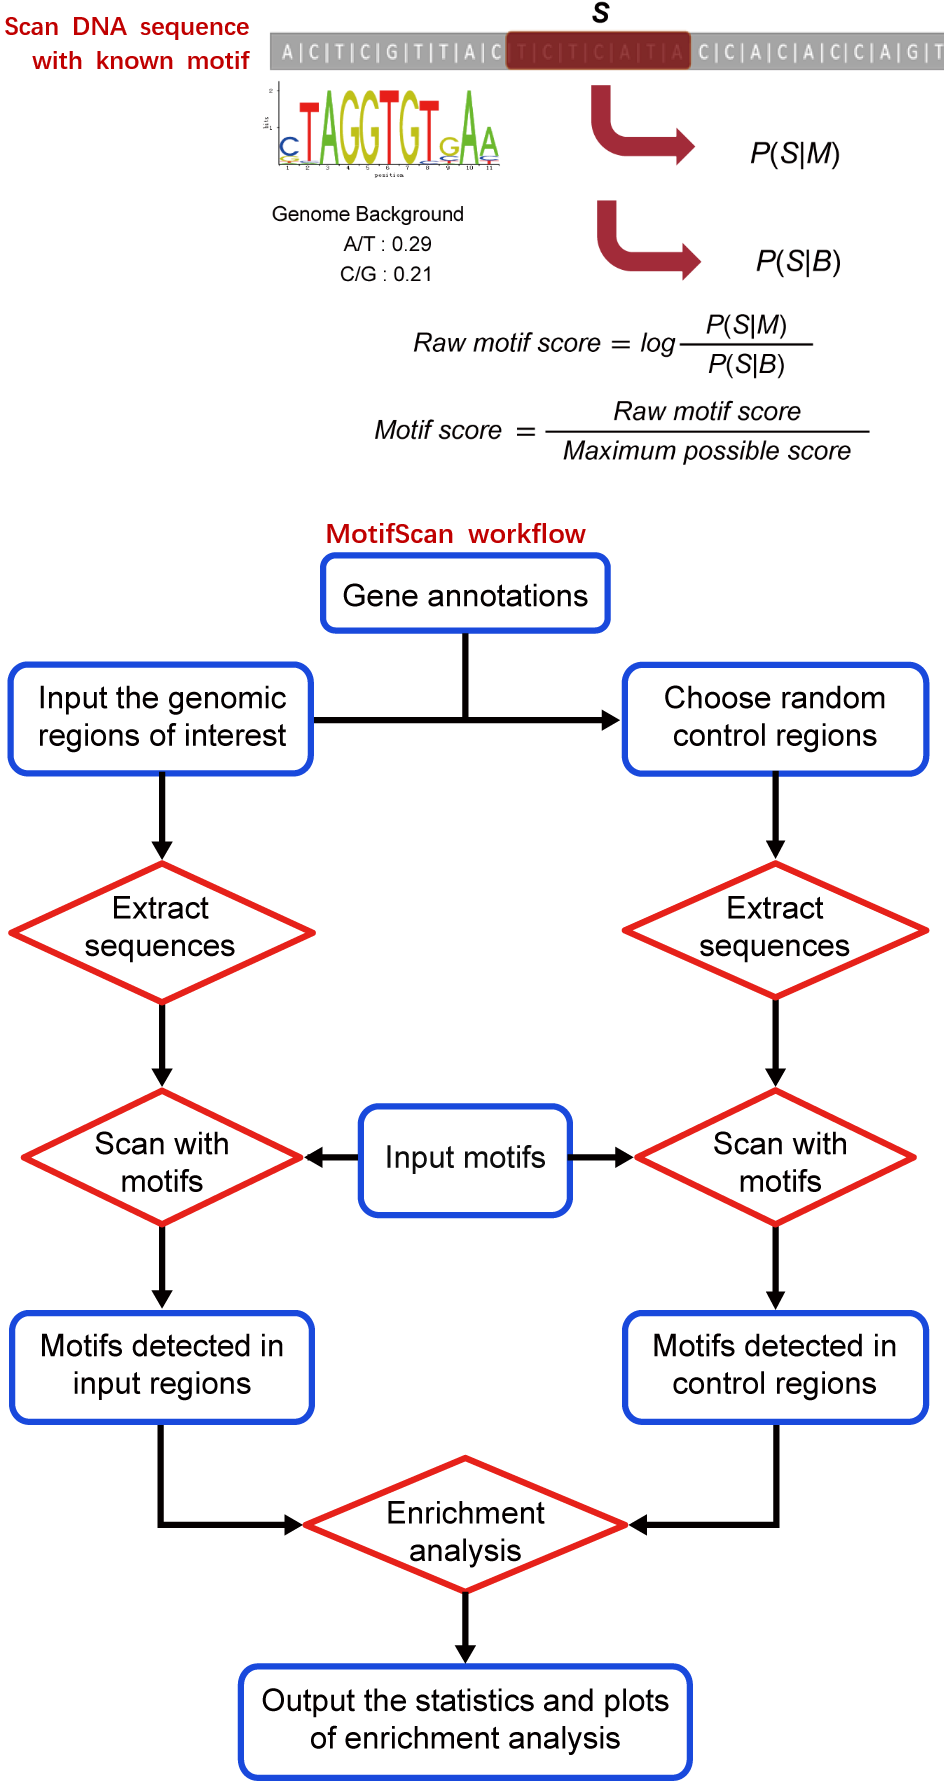
Motif-Scan is a computational toolkit that can be used to scan a set of input genomic regions with the DNA motifs from user or certain motif database such as JASPAR, and detect the occurrences of each motif in these regions that have significantly high sequence similarity with the motif. Then, it automatically applies a statistical test on each motif to check whether the motif is significantly over- or under-represented (enriched or depleted) in the input genomic regions compared to genome background as represented by a set of random control regions selected from the genome (or compared to another set of input genomic regions provided by user to check whether the motif is differentially distributed between these two groups of genomic regions, e.g. the unique peaks identified by comparing two sets of ChIP/DNase/ATAC-seq peaks). Finally, it will plot the distribution of each motif’s occurrences among the input genomic regions.

MAnorm: quantitative comparison of two ChIP-Seq samples

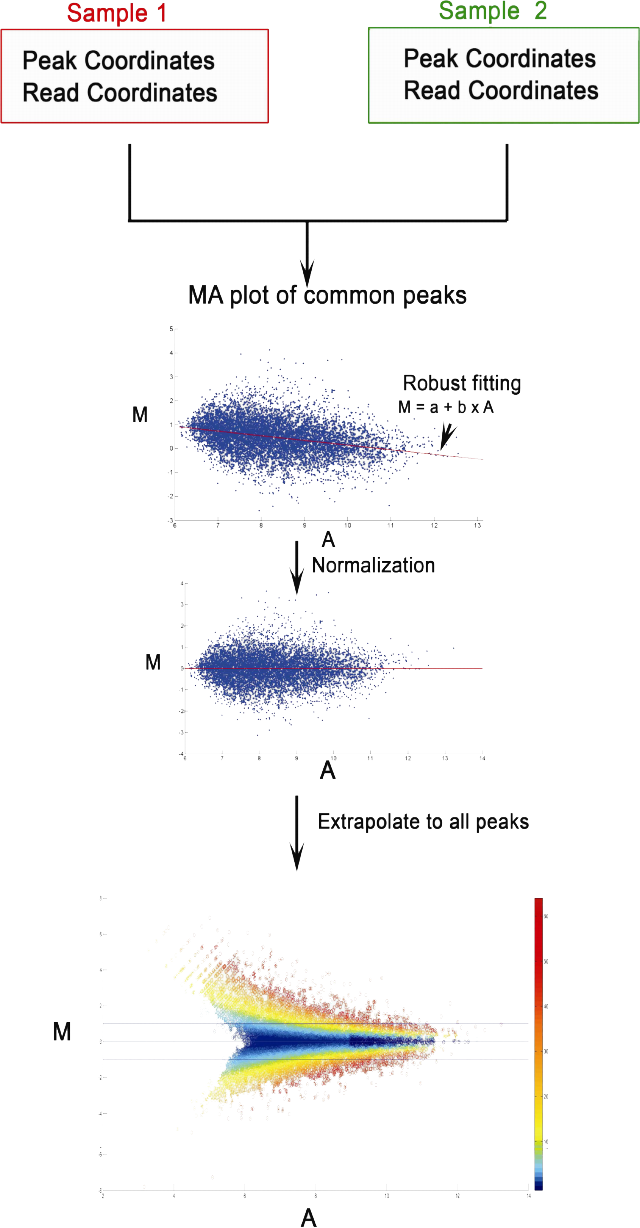
ChIP-Seq experiments are widely used to characterize the genome-wide binding of chromatin associated proteins including transcription factors, epigenetic regulators and histones with specific modifications. Comparing ChIP-Seq data from different cell types is critical for understanding the cell type-specific or cell type-biased binding of chromatin associated proteins. MAnorm is a robust computational model designed for quantitative comparison of two ChIP-Seq samples from different cell types. The key feature of MAnorm model is using the common peaks (binding sites) of two ChIP-Seq samples to build the reference model for ChIP-seq signal intensity normalization. For each peak site, MAnorm calculates a log2-ratio of normalized ChIP-seq read densities between two samples (i.e. the M values) to represent the quantitative change of ChIP-seq intensities at this peak, together with a P-value to represent the significance of the ChIP-seq intensity change. MAnorm can also be applied on DNase/ATAC-seq data to detect genomic regions with cell type-biased chromatin accessibility.