
|
zMAP toolset for large-scale model-based analysis of quantitative proteomic datasetTo be released soon. |

|
HyperChIP for detecting hyper-variable signals across ChIP/ATAC-seq samplesHyperChIP is designed as a complete statistical tool for quantitatively comparing a panel of ChIP/ATAC-seq samples (should also be applicable to DNase-seq data) and detecting hyper-variable signals across the samples. When the samples are generated with tissues or cells from patients of the same cancer type, the detected hypervariable signals could be potential epigenetic markers of different cancer subtypes/stages, which can be effectively used to reveal the underlying epigenetic heterogeneity structure of the patients. Besides, HyperChIP can also be used to compare normal tissue samples at different developmental stages/time points, or from healthy individuals with different genetic background, and the detected hypervariable signals can provide useful information for dissecting the similarity structure among the samples and detecting the underlying TF regulators of tissue development. HyperChIP can be implemented using the latest version of MAnorm2, which can be found at GitHub (https:// github.com/tushiqi/MAnorm2) or Zenodo (https://doi.org/10.5281/zenodo.5717729). HyperChIP paper (Chen and Tu et al. Genome Biology 2022) >>> |

|
MAnorm2 for quantitatively comparing groups of ChIP/ATAC/DNase-seq samplesMAnorm2 is designed to quantitatively compare two or multiple groups of ChIP-seq (or ATAC/DNase-seq) samples and detect differential binding (accessibility) on group level. First, when the samples of each group are biological replicates for the same experiment, differential analysis on the group level can achieve much better specificity and sensitivity than between individual samples. On the other hand, with ChIP-seq profiles for tissues/cells obtained from different individuals, uers can classify them based on the sex, health status, or disease subtype of each donor, and perform differential analysis between groups of profiles to identify the differential binding events associated with the group characteristics. MAnorm2 incorporates a hierarchical strategy of ChIP-seq data normalization across groups of samples, and performs differential analysis on group level by adaptive modeling of the within-group variation of ChIP-seq signals using an empirical Bayes framework. When the samples in each group are biological replicates, MAnorm2 can reliably detect differential binding events even between closely related cellular contexts. |

|
MAP: model-based analysis of isotope labeling-based proteomic dataMAP is designed to statistically compare two quantitative proteomic profiles generated using isotope-labeling technique (iTRAQ or TMT) and reliably identify proteins showing significant abundance changes between them (or peptides if the analysis is running on peptide level). As the key feature of MAP, it can directly model technical errors from the two proteomic profiles being compared, without borrowing information from parallel technical replicates. It considers all detected proteins as a mixture of differentially and non-differentially expressed ones, and chooses those with low intensity changes to model the contribution of technical and systematic error as a function of the protein intensity level by using a novel step-by-step regression analysis. This estimated error function is then used as the reference to calculate a P-value for each protein to represent the significance of its abundance change. |
|
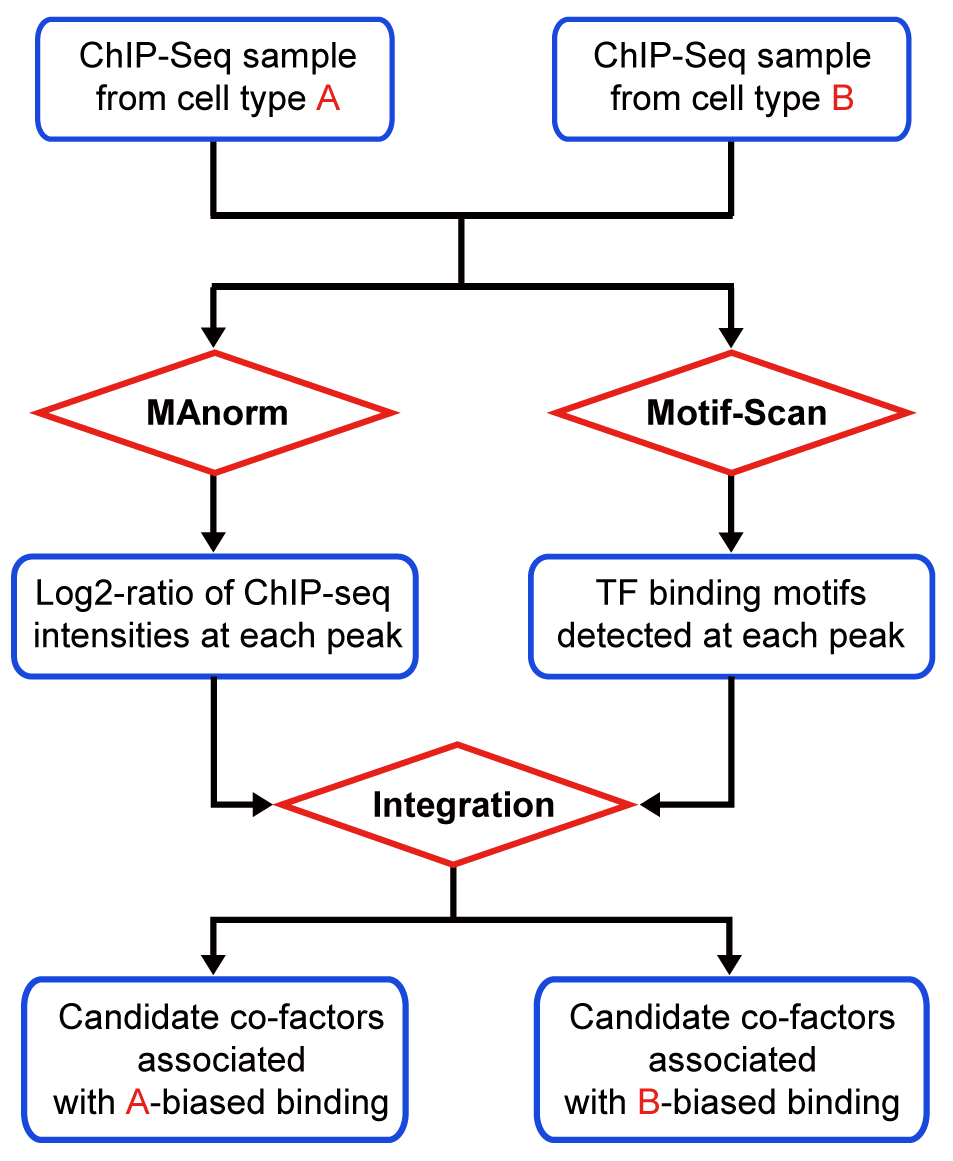
MAmotif for detecting cell type-specific TF regulatorsMAmotif can compare two ChIP-seq samples of the same protein but from different cell types (or conditions, e.g. wild-type vs mutant) and identify transcriptional factors (TFs) associated with its cell type-biased binding as candidate co-factors, by using TF binding information obtained from motif analysis (or from other ChIP-seq data). MAmotif automatically combines MAnorm model to perform quantitative comparison on input ChIP-seq samples together with Motif-Scan toolkit to scan ChIP-seq peaks for TF binding motifs, and uses a integrative analysis to search for TFs whose binding sites are significantly associated with the cell type-biased peaks between two ChIP-seq samples. When applying to ChIP-seq data of histone marks known to be associated with the activity of regulatory elements (such as H3K4me3 for active promoters and H3K27ac for active promoters and enhancers), or DNase/ATAC-seq data, MAmotif can be used to detect cell type-specific regulators. |
|
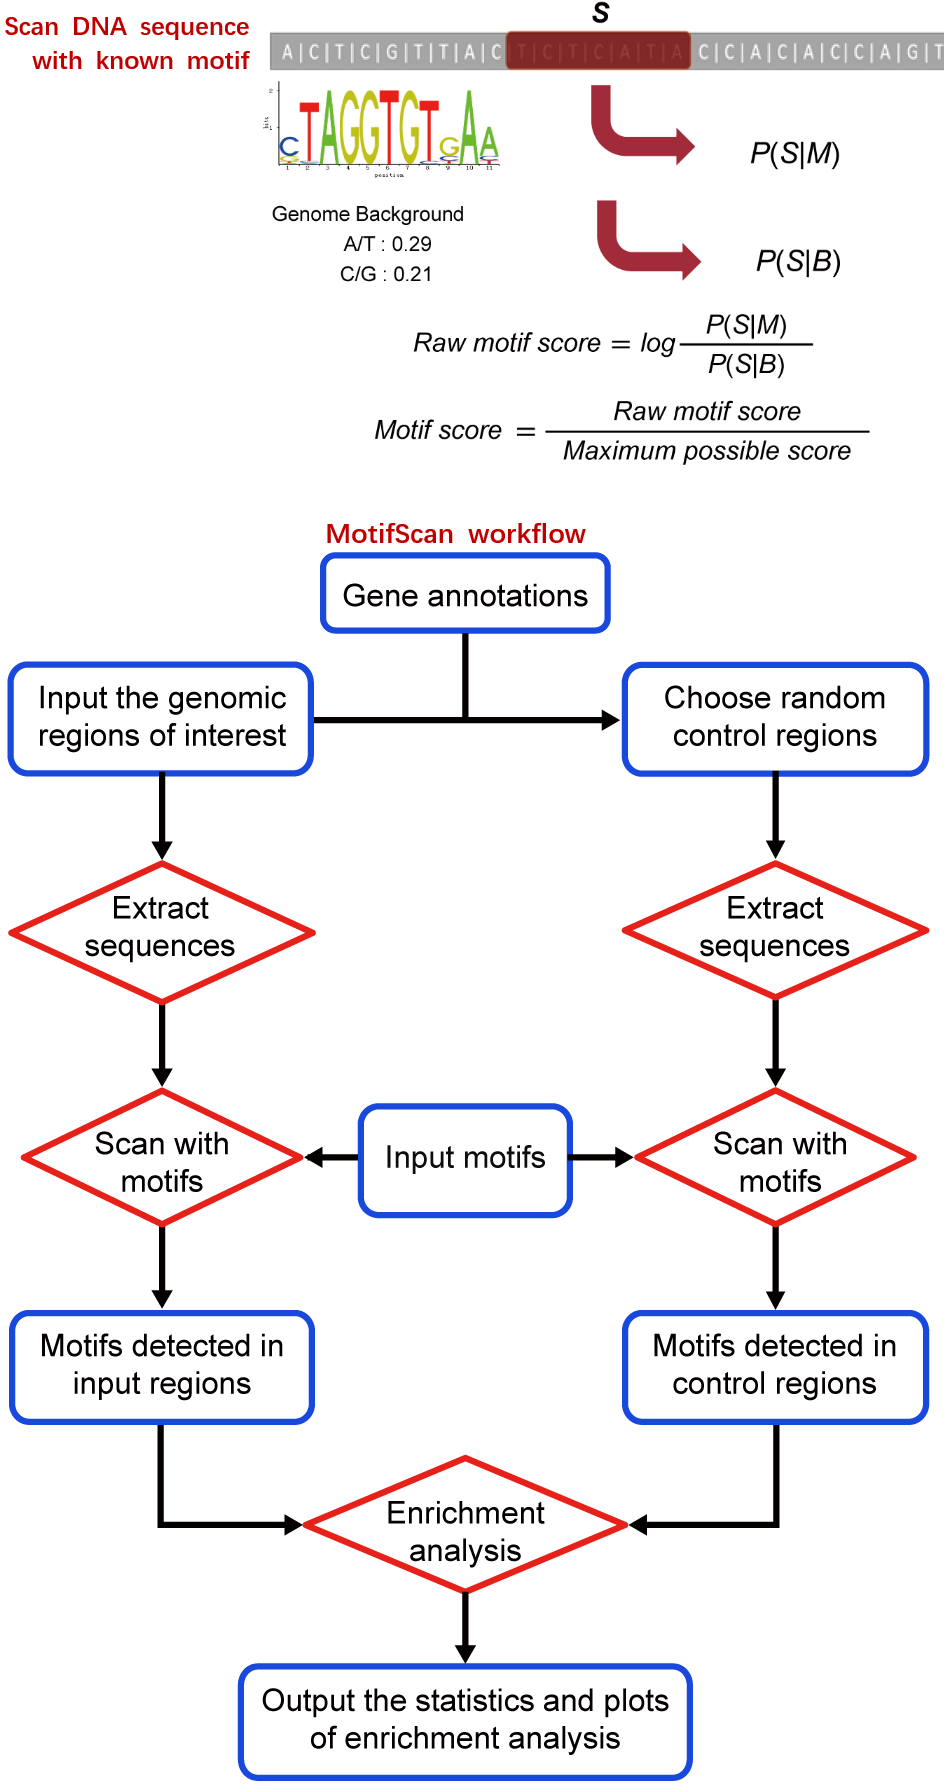
Motif-Scan: scan input genomic regions with known TF binding motifsMotif-Scan is designed to scan a set of input genomic regions with the DNA motifs from users or known TF binding motifs in JASPAR or other databases, and detect the occurrences of each motif in these regions that have significantly high sequence similarity scores. Then, it automatically tests whether the occurrences of each motif is significantly enriched or depleted in the input genomic regions compared to genome background, which is represented by a set of control regions selected from the genome (or compared to another set of input genomic regions provided by user to check whether the motif occurrences are differentially enriched between the two groups of genomic regions (e.g. the unique peaks identified by comparing two sets of ChIP/DNase/ATAC-seq peaks). Finally, it will plot the distribution of each motif’s occurrences among the input genomic regions. MAmotif paper (Sun et al. Cell Discovery 2018; see supp. materials) >>> Paper using MotifScan for enhancer analysis (Xu et al. Developmental Cell 2012) >>> |
|
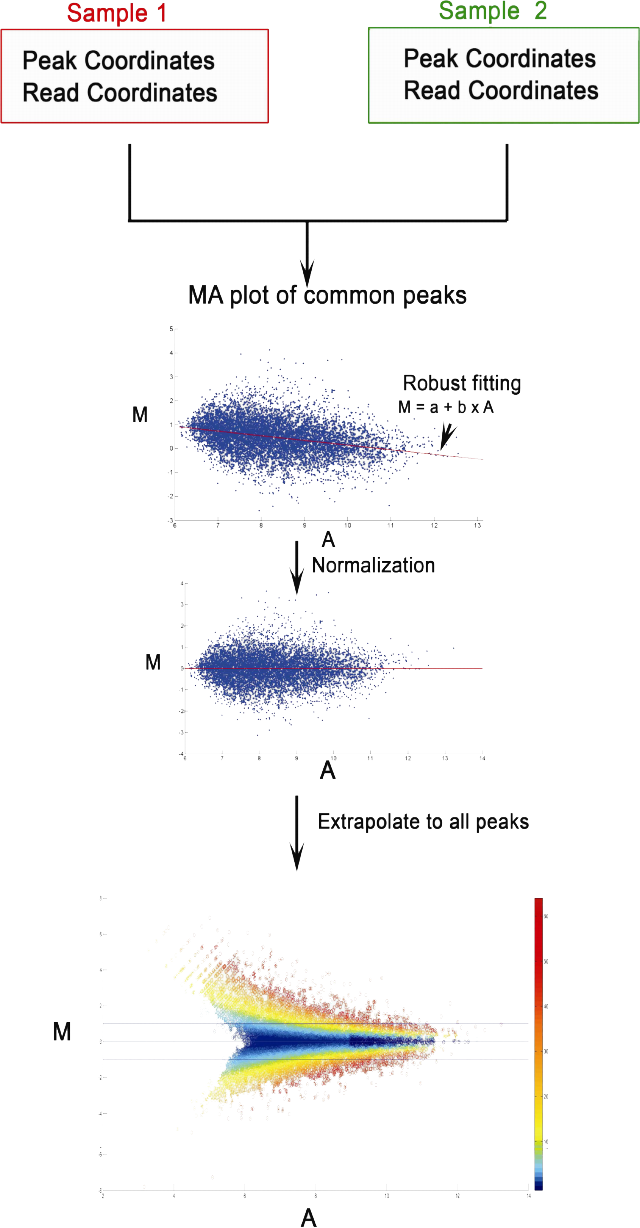
MAnorm for quantitatively comparing two ChIP-seq samplesMAnorm is designed to quantitatively compare two ChIP-seq samples (or ATAC/DNase-seq) and detect differential binding (or differential chromatin accessibility) between them. ChIP-Seq experiments are widely used to characterize the genome-wide binding of chromatin associated proteins including transcription factors, epigenetic regulators and histones with specific modifications. Comparing ChIP-Seq data from different cell types is critical for understanding the cell type-specific or cell type-biased binding of chromatin associated proteins. The key feature of MAnorm is using the common binding peaks of two ChIP-Seq samples to build a reference model for ChIP-seq signal intensity normalization. For each peak region, MAnorm calculates a log2-ratio of normalized ChIP-seq read densities between two samples (i.e. the M values) to quantitatively desribe the ChIP-seq intensity change at this peak, together with a P-value to represent the significance. MAnorm can also be applied on DNase/ATAC-seq data to detect genomic regions with cell type-biased chromatin accessibility.. MAnorm Python version @Github >>> |